Fuel Type Breakdown
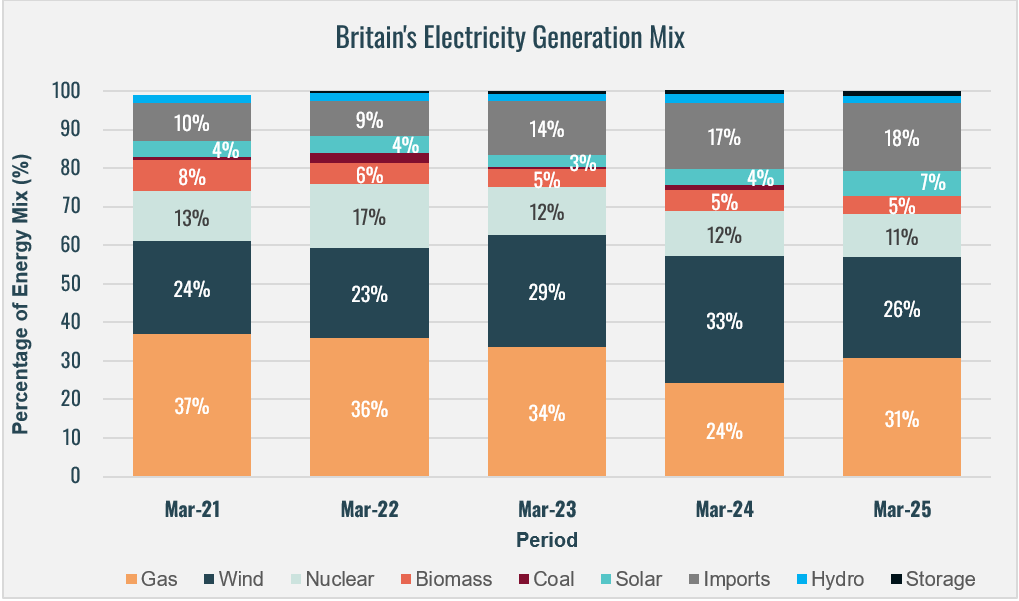
In March 2025, gas was the leading source of Britain's electricity generation, contributing 31% of the energy mix, a 7% increase from March 2024. However, this was the second-lowest gas share for March in the last five years.
Wind energy accounted for 26%, down 7% from March 2024.
Solar contributed 7%, up 3% year-on-year, it's highest contribution for March in the previous five years.
Hydro and storage maintained consistent contributions of 3% and 1%, respectively, matching their performance for every March in the last five years.
Biomass contributed 5%, the same as March 2024; however, 3% below it's share in March 2021.
Coal contributed 0%, following its phase-out in September 2024. For comparison, coal made up 1% of the mix in March 2024.
Zero-Carbon Sources & Carbon Intensity
Zero-carbon sources delivered 45% of Britain's electricity in March 2025 - 6% lower than March 2024 and the second-lowest March share in the past five years. This decline led to a higher carbon intensity, with emissions at 146 gCO₂/kWh, up 15% from March 2024.
The rolling 12-month average for zero-carbon electricity remained at 50%, unchanged from the previous period, indicating stagnation in renewable integration. However, carbon intensity over this 12-month period continues to be the lowest of the past five years, at 127 gCO₂/kWh, and 14% lower than the previous 12-month period.
Increasing renewable electricity generation remains crucial to achieving net-zero goals, enhancing energy security, and reducing reliance on imports.
Britain's Electricity Summary Charts
Monthly Statistics
To explore more insights, visit our interactive renewables map
here.
Data source: National Grid ESO 2025
(https://www.nationalgrideso.com/electricity-explained/electricity-and-me/great-britains-monthly-electricity-stats)