Britain's Electricity Generation - October 2024
18 November 2024
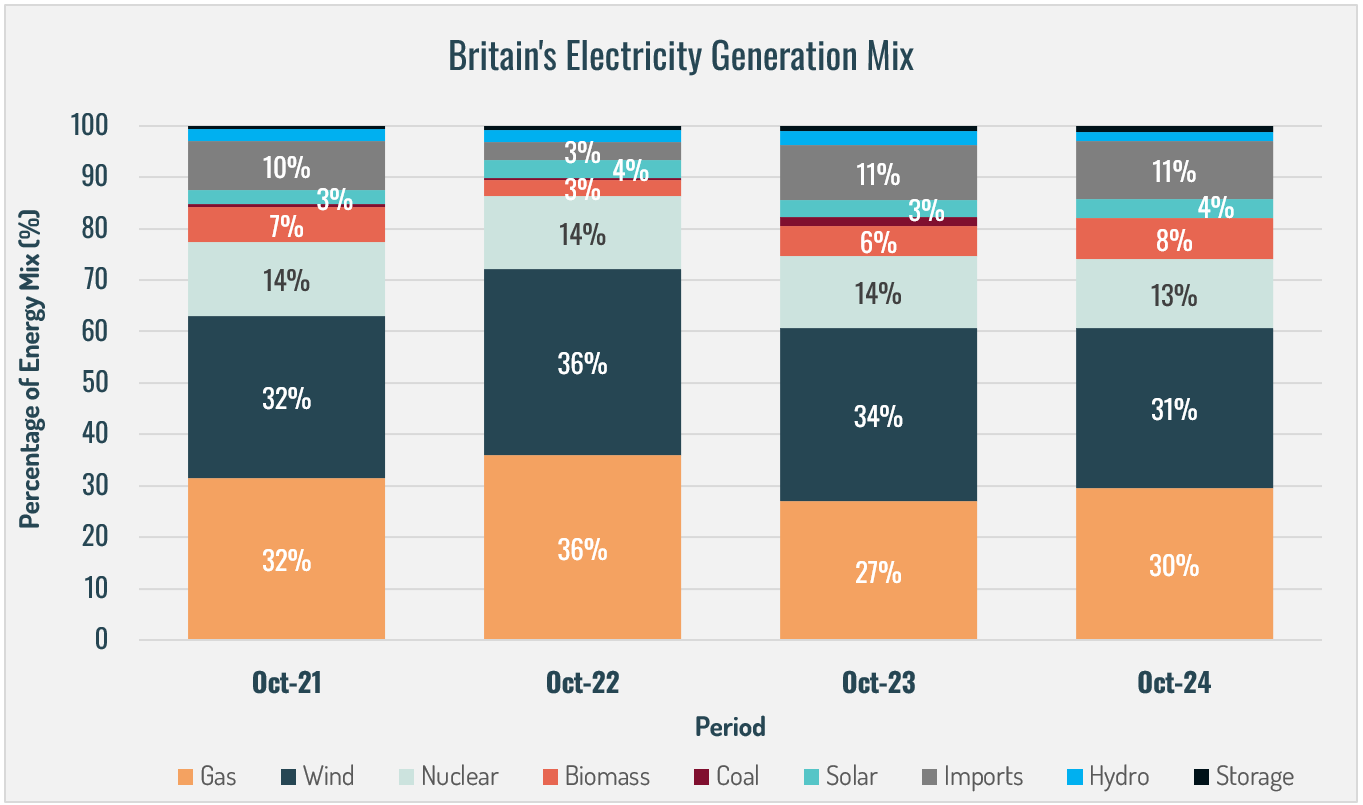
- In October 2024, wind was the leading source of electricity generation in Britain, accounting for 31% of the electricity mix. Despite this, wind’s contribution was the lowest for any October in the past four years, down 3% from October 2023 and 5% from October 2022. Gas followed closely, contributing 30% to the electricity mix, which, while its second-lowest for October in the past four years, was still 3% higher than in October 2023.
- Biomass contributions increased by 2%, reaching 8% of the mix, the highest for October in the past four years. Solar energy provided 4% of the mix, up 1% from October 2023.
- Nuclear and hydro both saw a 1% decrease in their contributions, delivering 13% and 2% of the electricity mix, respectively. Imports remained steady, contributing 11%, the same as in October 2023.
- October 2024 was notable for having zero coal in Britain’s electricity generation, following the closure of the Ratcliffe power plant, the UK’s last coal-fired station. This is a significant achievement, considering coal has provided electricity in the UK for over 140 years and accounted for nearly 40% of the UK’s electricity generation in 2012.
- Zero-carbon sources made up 51% of Britain’s electricity generation in October 2024, the lowest for any October in the past four years, but only 1% below the rolling 12-month average of 52%. The carbon intensity of electricity generation in October 2024 was 138gCO₂/kWh, consistent with October 2023. The rolling 12-month average carbon intensity of 123gCO₂/kWh is 22% lower than the previous 12-month period, marking the lowest level in the past four years as the grid continues to decarbonise.
- Increasing the electricity generation from renewable sources can help achieve our net-zero ambitions, ensure energy security, and decrease reliance on imports.
Monthly Statistics
12-Month Rolling (Average) Statistics
To view our interactive renewables map,
click here
Data source: National Grid ESO 2024 (https://www.nationalgrideso.com/electricity-explained/electricity-and-me/great-britains-monthly-electricity-stats)

Fuel Type Breakdown Britain’s electricity generation in May 2026 was led by wind, which contributed 25% of the energy mix. While slightly below the 27% recorded in May 2025, it is still above its contribution in May in prior years. Gas supplied 23% of electricity in May 2026, up modestly from 20% in May 2025. While this increase reflects some variability in renewable output, gas usage remains significantly below levels seen earlier in the decade and is almost half of its value in May 2022, indicating continued progress in reducing dependence on fossil fuels. Electricity imports accounted for 19% of the generation mix, up from 17% in May 2025 and representing one of the highest May shares in recent years. Nuclear power contributed 11%, down from 15% in May 2025 and continuing the trend of lower nuclear output compared to historical levels. Biomass generation remained stable at 7%, unchanged from May 2025 and continuing to provide a reliable source of low‑carbon, dispatchable power. Solar output contributed 12%, consistent with May 2025 and reflecting strong seasonal performance as daylight hours increase. Storage technologies contributed 2%, steady compared to May 2025 and maintaining their highest May share on record. This reinforces the growing importance of battery & storage assets in balancing the grid as renewable penetration increases. Hydropower remained at 1%, in line with recent years and continuing to provide a small but consistent contribution. Coal once again remained absent from the generation mix, reinforcing Britain’s continued transition away from coal‑fired electricity generation following its phase‑out in 2024. Zero-Carbon Sources & Carbon Intensity Zero‑carbon sources, including wind, solar, nuclear, and hydro, generated 65% of Britain’s electricity in May 2026, representing a notable increase from 57% in May 2025 and continuing the broader upward trend in renewable and low‑carbon generation. Carbon intensity rose to 122 gCO₂/kWh in May 2026, compared to 106 gCO₂/kWh in May 2025. Despite this year‑on‑year increase, carbon intensity remains significantly below levels seen earlier in the decade and reflects the ongoing transition to a lower‑carbon power system. On a rolling 12‑month basis, carbon intensity sat at 123 gCO₂/kWh, down from 129 gCO₂/kWh in the previous period. Meanwhile, the rolling 12‑month average for zero‑carbon generation is 64%, marking continued progress in decarbonising Britain’s electricity system. Peak zero‑carbon generation reached 93% during May 2026, not quite reaching the 99% recorded in April 2026, but respectable nonetheless, and above the 86% recorded in May last year. Concluding Remarks May 2026 continued to demonstrate sustained progress in Britain’s energy transition, with zero‑carbon generation remaining high and the system maintaining a majority low‑carbon electricity mix. While wind output eased slightly compared to May 2025, strong solar performance and steady contributions from other low‑carbon sources helped maintain overall decarbonisation progress. At the same time, a modest increase in gas generation and higher reliance on imports highlight the continued need for flexible and firm power sources to support system stability. Looking ahead, maintaining momentum will depend on continued investment in renewable capacity, alongside further expansion of storage and flexible low‑carbon solutions. These will be critical to managing variability, reducing reliance on imports, and sustaining long‑term emissions reductions as Britain’s electricity system continues to evolve. Britain's Electricity Summary Charts
Fuel Type Breakdown Britain’s electricity generation in April 2026 was led by wind, which contributed 31% of the energy mix. While slightly below the 35% recorded in April 2024, this represents a strong performance and a notable 9 percentage point increase compared to April 2025. Wind’s continued strength highlights its central role in Britain’s increasingly renewable-led power system as spring conditions support higher output. Gas supplied 16% of electricity in April 2026, down significantly from 26% in April 2025. This 10 percentage point reduction marks the lowest April contribution from gas in recent years and reflects continued progress in reducing reliance on fossil fuels. Electricity imports accounted for 15% of the generation mix, down 3 percentage points from April 2025 but still representing a meaningful share of Britain's supply. This underlines the continued importance of interconnectors in supporting overall system flexibility. Nuclear power contributed 16%, up from 13% in April 2025, marking a modest recovery and providing an important source of firm low‑carbon generation. Biomass generation remained steady at 7%, consistent with April 2025. Solar output reached 11%, unchanged from April 2025, though higher than winter months, reflecting the increased generation associated with longer daylight hours during spring. Storage technologies contributed 2%, consistent with April 2025 and maintaining their highest April share on record. This highlights the ongoing growth and importance of battery & storage assets in balancing renewable generation. Hydropower increased slightly to 2%, up from 1% in April 2025, remaining broadly consistent with historical norms. Coal once again remained absent from the generation mix, following its phase‑out from Britain's electricity generation in 2024. Zero-Carbon Sources & Carbon Intensity Zero‑carbon sources, including wind, solar, nuclear, and hydro, generated 78% of Britain’s electricity in April 2026. This marks the highest April share on record and a substantial increase of 32 percentage points compared to April 2025. Carbon intensity declined sharply to 93 gCO₂/kWh in April 2026, representing a 30% reduction compared to the 133 gCO₂/kWh recorded in April 2025. This near-record low reflects strong renewable generation, particularly from wind and solar, alongside significantly reduced gas usage. On a rolling 12‑month basis, carbon intensity fell to 122 gCO₂/kWh, down from 131 gCO₂/kWh in the previous period (7% reduction). Meanwhile, the rolling 12‑month average for zero‑carbon generation increased to 63%, indicating sustained progress in decarbonising Britain’s electricity system over the past year. Peak zero‑carbon generation reached 99% during April 2026, the highest on record. This highlights the system’s growing ability to operate at near‑fully decarbonised levels during periods of favourable renewable conditions. Concluding Remarks April 2026 marked another significant milestone for Britain’s electricity system. Wind remained the dominant generation source, zero‑carbon generation reached record levels, and carbon intensity fell sharply year‑on‑year. The reduction in gas usage, coupled with strong contributions from wind and solar, demonstrates the system’s increasing ability to operate with minimal fossil fuel input during favourable conditions. At the same time, nuclear, imports, and storage continue to play important supporting roles in maintaining system stability. Looking ahead, sustaining this level of performance will depend on continued investment in renewable capacity, alongside further expansion of storage and flexible low‑carbon generation. These will be critical to maintaining progress in emissions reductions and ensuring a resilient, low‑carbon electricity system as Britain moves further into the summer months. Britain's Electricity Summary Charts
Fuel Type Breakdown Britain’s electricity generation in March 2026 was led by wind, which contributed 35% of the energy mix. This represents a strong rebound from the 26% recorded in March 2025 and marks wind’s highest March share on record. Wind once again overtook gas to become the dominant source of electricity, underlining its growing central role as Britain transitions into spring with continued strong renewable output. Gas supplied 22% of electricity in March 2026, a significant decrease from 31% in March 2025. This 9 percentage point reduction reflects both stronger renewable generation and continued progress in limiting reliance on fossil fuels, particularly outside peak winter demand. Electricity imports accounted for 16% of the generation mix in March 2026. While slightly lower than the 18% recorded in March 2025, imports remain an important contributor, highlighting the ongoing role of interconnectors in maintaining system resilience and flexibility. Nuclear power contributed 11%, unchanged from March 2025 and continuing a period of relatively subdued nuclear availability compared to historical norms. Biomass generation increased modestly to 6%, up from 5% in March 2025, continuing to provide a stable source of low‑carbon, dispatchable generation. Solar output reached 6%, slightly below the 7% recorded in March 2025 but broadly in line with seasonal expectations as daylight hours increase into spring. Storage technologies contributed 2% of total generation, doubling from 1% in March 2025 and marking the highest March contribution on record. This increase reflects the continued expansion and importance of battery & storage assets in balancing a more renewables‑led system. Hydropower remained stable at 2%, consistent with recent years. Coal once again remained absent from the generation mix, reinforcing Britain’s continued exit from coal‑fired electricity generation following its phase‑out in 2024. Zero-Carbon Sources & Carbon Intensity Zero‑carbon sources, including wind, solar, nuclear, hydro, and biomass, generated 66% of Britain’s electricity in March 2026. This represents the highest March share on record and a substantial increase of 21 percentage points compared to March 2025. Carbon intensity fell sharply to 117 gCO₂/kWh in March 2026, making it 20% cleaner than the 146 gCO₂/kWh recorded in March 2025. This marks the lowest March carbon intensity on record and reflects the combined impact of strong wind generation, reduced gas usage, and rising contributions from storage and other low‑carbon sources. On a rolling 12‑month basis, carbon intensity declined slightly to 125 gCO₂/kWh, down from 127 gCO₂/kWh in the previous period. Meanwhile, the rolling 12‑month average for zero‑carbon generation increased to 60%, highlighting sustained progress in decarbonising Britain’s electricity system over the past year. Concluding Remarks March 2026 marked a major step forward for Britain’s power sector. Wind reclaimed its position as the dominant generation source, zero‑carbon generation exceeded two‑thirds of total output, and carbon intensity fell to record‑low levels for the month. While gas continues to play a role in system balancing, its share declined materially year‑on‑year. Imports and nuclear generation remained important supporting contributors, while the growing role of storage is increasingly evident. Looking ahead to the summer months, maintaining high renewable output, alongside continued investment in flexibility, storage, and firm low‑carbon capacity, will be critical in sustaining emissions reductions and strengthening Britain’s long‑term energy resilience. Britain's Electricity Summary Charts

PRESS RELEASE FOR IMMEDIATE RELEASE Gloucestershire County Council has selected edenseven’s cutting-edge sustainability management platform, cero.earth, to strengthen emissions reporting, improve collaboration with its suppliers, inform investment decisions and support delivery of its climate commitments.Corporate Accountability Exposed as Climate Commitments Fail to Deliver.

Why the transition to a lower carbon economy is fundamentally about operational resilience. For the past decade, sustainability has steadily moved up the corporate agenda. Boardrooms have become familiar with terms such as net zero, ESG reporting, and climate disclosures. Businesses have been asked to publish targets, measure emissions, and demonstrate progress against a growing range of frameworks. But somewhere along the way, the conversation became overly complicated. For many business leaders, sustainability began to feel less like a commercial strategy and more like a reporting exercise. ESG ratings, disclosure requirements, and long-term commitments increasingly dominated the discussion. In some organisations, this created frustration and fatigue. Leaders struggled to connect sustainability narratives with the practical realities of running a business. Yet the truth is far simpler than the debate suggests. Sustainability is not only about reputation or reporting. Financial returns and resilience are becoming priorities for businesses. Recent global events are reminding us of that reality. The Return of Energy Security For most companies, energy has returned to the centre of strategic decision-making. Recent geopolitical developments have once again exposed how fragile global energy systems can be. Escalating tensions in the Middle East and the resulting conflict involving the United States, Israel, and Iran have already triggered renewed volatility in oil markets. These developments are not isolated shocks; they are part of a broader shift in how global energy markets operate. For a long time now, energy commodity prices have not simply been influenced by supply and demand. They have been shaped by geopolitics, national security concerns, and global power dynamics. For business, this matters enormously. Energy volatility rarely remains confined to commodity markets. It quickly feeds into manufacturing costs, logistics, procurement decisions, and the price of goods and services. Supply chains tighten, inflation rises, and margins come under pressure. This is why energy security has rapidly returned to the board agenda. Leadership teams are now asking themselves the question: How exposed is our business to energy market shocks? Organisations that cannot answer that question clearly are increasingly recognising a deeper vulnerability within their operations. The Sustainability Narrative Lost Its Way At the same time that energy volatility has returned, the sustainability conversation itself has been undergoing a correction. Over the past few years, many businesses experienced what has often been described as ‘ESG fatigue’. Sustainability became associated with reporting frameworks, compliance obligations, and external scrutiny. The narrative grew increasingly complex, while the operational relevance sometimes became less clear. In some cases, sustainability programmes became disconnected from the core drivers of business performance. That disconnect has been exposed by the current global environment. When energy prices surge or supply chains become unstable, businesses quickly rediscover what sustainability was always meant to address: resource security and operational efficiency. The companies navigating this environment most successfully are not necessarily those with the most ambitious climate targets. They are the organisations that have invested in improving how their operations use energy, materials, and resources. They understand that sustainability is not an abstract environmental concept. It is a practical operational strategy. Businesses that use less energy, generate more of their own power, and reduce dependency on volatile commodity markets are fundamentally more resilient. They are also structurally more competitive. Sustainability Is Really About Risk and Competitiveness Seen through the right lens, sustainability is simply another form of risk management. Businesses today operate within a landscape of increasing regulatory scrutiny, rising energy costs, and growing expectations from investors and supply chains. At the same time, climate-related disruptions and geopolitical tensions are introducing new uncertainties into global markets. For many organisations, sustainability risks now intersect directly with core business risks. Energy price exposure can reshape operating margins. Supply chain disruptions can affect product availability and customer relationships. Investor expectations around climate risk can influence access to capital. Even insurance markets are beginning to factor climate resilience into underwriting decisions. Ignoring these realities does not remove the risk. It simply increases exposure. Yet the most interesting aspect of the sustainability transition is that the same actions that reduce risk often strengthen competitiveness. Businesses that improve energy efficiency lower their operating costs. Companies that electrify operations reduce dependency on volatile fossil fuel markets. Organisations that invest in on-site renewable energy gain greater control over their energy supply. In volatile markets, the businesses with the lowest and most stable energy costs will inevitably outperform those that remain exposed to global commodity shocks. This is why investors are increasingly shifting their focus. Rather than simply assessing climate commitments, they are looking at something far more fundamental: transition readiness and operational resilience. The Companies That Win Will Have Structurally Lower Costs The transition to a lower-carbon economy will not unfold evenly across industries. Some sectors will move faster than others, and the pace of policy change will continue to vary between regions. But one outcome is already becoming clear. The companies that succeed in this transition will have structurally lower energy, material and carbon costs than their competitors. They will operate with more efficient processes, smarter infrastructure, and more resilient supply chains. They will generate a greater share of their own energy and rely less on volatile global commodity markets. In other words, they will have fundamentally stronger business models. This is where the sustainability conversation needs to return. For too long, sustainability has been framed primarily as a reputational issue or a long-term climate commitment. While those elements remain important, they are not the primary reason why businesses are engaging with sustainability today. The real driver is economics. Energy, materials, and resources underpin every industry. Businesses that can secure them more efficiently and manage them more intelligently will always have a competitive advantage. In that sense, sustainability is not separate from business strategy. It is becoming the strategy. As global markets continue to evolve, leadership teams face a defining question. Will sustainability remain a reporting exercise within their organisation, driven by compliance and external expectations? Or will it become a strategic tool used to strengthen resilience, reduce costs and secure long-term competitiveness? The companies that answer that question early are already positioning themselves differently. In a volatile world, operational resilience may prove to be the most valuable asset a business can build. Supporting Organisations Through The Transition At edenseven, we work with organisations that want to approach sustainability as a strategic opportunity rather than simply a reporting requirement. Our focus is on helping leadership teams understand how sustainability connects directly to operational resilience, energy strategy and long-term cost competitiveness. This means looking beyond frameworks and targets to focus on the practical decisions that shape business performance: energy infrastructure, resource efficiency, supply chain resilience, and credible transition planning. The organisations that will lead the transition are not necessarily those making the loudest commitments. They are the ones building structurally stronger and more resilient operations. If you would like to explore how sustainability can strengthen your organisation’s operational resilience and competitive positioning, we would welcome the opportunity to start that conversation. Speak to a member of the edenseven team today!
Fuel Type Breakdown Britain’s electricity generation in February 2026 was led by wind, which contributed 36% of the energy mix. While slightly below the 40% recorded in February 2022, this represents strong performance and a 4 percentage point increase compared to February 2025. February 2026 also marked the seventh consecutive month that wind has been Britain’s dominant source of electricity, outpacing gas, reinforcing its position at the centre of the country’s power system. Gas supplied 29% of electricity in February 2026, down from 33% in February 2025, but still a significant contributor to the overall mix. This reduction reflects continued progress in limiting fossil fuel reliance. Electricity imports accounted for 12% of the generation mix, unchanged from February 2025 and broadly consistent with recent years. This sustained level highlights the ongoing role of interconnectors in supporting system stability. Nuclear power contributed 11%, slightly down from 12% in February 2025 and continuing the trend of reduced nuclear availability compared to earlier in the decade. Biomass generation remained steady at 7%, providing a reliable source of low-carbon, dispatchable power. Solar output contributed 2%, in line with seasonal expectations and unchanged from the previous year. Storage technologies increased their contribution to 2%, up from 1% in February 2025 and marking the highest February share on record. This reflects continued growth and the increasing importance of battery & storage assets in managing system flexibility. Hydropower fell to 1%, down from 2% in February 2025, representing one of the lowest February contributions in recent years. Coal remained absent from the generation mix, following its removal from Britain's electricity generation in 2024. Zero-Carbon Sources & Carbon Intensity Zero-carbon sources, including wind, solar, nuclear, and hydro, generated 63% of Britain’s electricity in February 2026. This marks the highest February share in the past six years and a 15 percentage point increase compared to February 2025. Carbon intensity declined to 136 gCO₂/kWh, 7% cleaner than the 147 gCO₂/kWh in February 2025 and continuing the broader downward trend compared to historical levels. This reduction reflects stronger renewable generation, particularly from wind, alongside lower gas usage. On a rolling 12-month basis, carbon intensity stood at 128 gCO₂/kWh, slightly higher (2%) than the previous period but still significantly below levels seen earlier in the decade. Meanwhile, the rolling 12-month average for zero-carbon generation rose to 59%, indicating continued progress in decarbonising Britain’s electricity system. Concluding Remarks February 2026 continued the positive momentum seen at the start of the year. Wind remained the dominant generation source for a seventh consecutive month, and notably, February 2026 also marked the seventh consecutive month of renewable-dominated electricity generation in Britain. Zero-carbon output exceeded 60%, while carbon intensity declined year-on-year. Despite this progress, gas continues to play a key role in balancing the system during winter months, while nuclear output remains below historic levels and imports continue to support supply. Looking ahead, maintaining strong renewable performance, alongside further investment in storage and firm low-carbon capacity, will be essential to sustaining emissions reductions and strengthening Britain’s long-term energy resilience. Britain's Electricity Summary Charts
edenseven are following trends in the renewable energy sector closely, as decarbonising the energy sector is vital for ensuring a sustainable future and achieving Net Zero. Considering the recent DESNZ quarterly update of the renewable energy planning database, we have produced a consolidated summary of projects in the United Kingdom that have received planning permission. We will continue to release updates each quarter. Key Insights: In the 12 months to the end of Q4 2025, the UK approved 677 solar PV projects, a 14% year-on-year increase and the second-highest rolling 12-month total on record. Together, these projects will deliver a record 6,075 MW of capacity, 37% more than the previous peak year in 2023. 2025 was a landmark year for UK offshore wind. Eight projects were approved, unlocking a record-breaking 9,900 MW of capacity, nearly double the previous peak set in 2015 and almost seven times the 1,282 MW approved in 2024. Onshore wind approvals rose to 56 projects. While this ranks only eighth by project count, their combined capacity of 1,734 MW is the second-highest total on record.

Fuel Type Breakdown Britain’s electricity generation in January 2026 was led by wind, which supplied 37% of the energy mix. This marks a strong rebound from the 27% recorded in January 2025 and represents the highest January contribution in the past five years. Wind outperformed gas by 6 percentage points, reinforcing its growing role as the backbone of winter electricity generation. Gas accounted for 31% of electricity generation in January 2026, down from 38% in January 2025 but still reflecting its continued role in meeting peak winter demand. Despite the year-on-year decline, gas remained the second-largest source of generation during the month. Electricity imports contributed 11% of the generation mix, slightly lower than January 2025 but broadly in line with recent winters. This continued reliance on imports highlights the importance of interconnectors in balancing domestic supply during periods of high demand. Nuclear power supplied 10% of electricity, down from 12% in January 2025 and well below levels seen earlier in the decade. This ongoing reduction reflects the continued decline of nuclear electricity generation in Britain. Biomass generation increased to 7%, up from 6% in January 2025, providing a stable source of dispatchable low-carbon power. Solar generation contributed 2%, consistent with recent January levels and reflecting limited seasonal output. Storage technologies supplied 2% of the mix, matching January 2025 and marking the joint-highest January contribution on record. This continued growth highlights the increasing importance of battery and storage assets in managing system flexibility. Hydropower remained steady at 2%, consistent with recent January performance. Coal remained absent from the generation mix, following its removal from Britain’s electricity generation in 2024. Zero-Carbon Sources & Carbon Intensity Zero-carbon sources, including wind, solar, nuclear and hydro, delivered 61% of Britain’s electricity in January 2026. This represents a significant improvement on January 2025’s 43% and the highest January share in the past five years. Carbon intensity fell to 144 gCO₂/kWh, a notable reduction (14%) compared with 168 gCO₂/kWh in January 2025 and broadly in line with January 2023 levels. This improvement reflects the stronger contribution from wind, storage and biomass alongside reduced gas generation. On a rolling 12-month basis, carbon intensity stood at 129 gCO₂/kWh, slightly higher than the previous rolling period but still well below historical averages. Meanwhile, the rolling 12-month average for zero-carbon generation increased to 57% (up by 6 percentage points), underlining continued long-term progress in decarbonising Britain’s electricity supply. Concluding Remarks January 2026 marked a strong start to the year for Britain’s electricity transition. Wind reclaimed its position as January's leading power source, following two years of gas-led January generation. Zero-carbon generation exceeded 60%, and carbon intensity fell sharply compared to the previous January. However, gas continued to play a significant role in meeting winter demand, while nuclear output remained subdued, and imports continued to play a large role in supporting system balance. Sustaining progress through the remainder of the year will depend on maintaining high renewable output, accelerating storage deployment, and further reducing our reliance on fossil-fuel-sourced energy. Britain's Electricity Summary Charts
Finding 1: Wind Energy Dominated Britain's Electricity Generation in 2025 In 2025, wind energy was Britain’s largest source of electricity generation, supplying around a third (30%) of total electricity. Wind now makes up almost 10% more of Britain's electricity mix than it did in 2021, underscoring its role as the backbone of Britain’s electricity system (figures 1 & 2). Finding 2: Gas Levels Have Fallen Dramatically Since 2021 Gas generation declined by almost 15%, falling from 39% of Britain’s electricity mix in 2021 to 26% in 2025. After a sharp decline between 2021 and 2024, gas output stabilised in 2025, indicating a new, lower baseline for fossil-fuel generation (figures 1 & 2). Finding 3: Coal Absent from Britain's Electricity Mix in 2025 Coal’s share of generation fell from 2% in 2021 to 0% in 2025, making 2025 the first full year with no electricity generation in Britain from coal. This is a major milestone for Britain’s electricity decarbonisation and a significant step to reduce emissions (figures 1 & 2). Finding 4: Solar, Storage, and Imports Played a Growing Role Between 2021 and 2025, solar generation increased from supplying 4% of Britain's electricity, to 7% in 2025, while storage has doubled from 1% to 2% in 2025. Over the same period, imported energy has risen from 10% to 15% of Britain's electricity mix, highlighting a strong need to balance domestic low-carbon generation and improve grid flexibility (figures 1 & 2).

Fuel Type Breakdown Britain’s electricity generation in December 2025 was once again led by wind, which supplied 38% of the energy mix. While slightly below the 39% recorded in December 2024 and the 41% peak in December 2023, wind maintained its dominant position and continued to outperform all other generation sources. Wind generation exceeded gas output by 13 percentage points, underlining its central role in Britain’s winter electricity supply. Gas accounted for 25% of electricity generation in December 2025, its lowest December share in the past five years, and 13 percentage points below December 2021. This continued decline highlights sustained progress in reducing reliance on fossil fuels, particularly during peak winter demand. Electricity imports rose to 15% of the generation mix, the highest December share over the past five years and up 5 percentage points year-on-year. This increase reflects growing reliance on cross-border electricity flows to support domestic supply during periods of high demand. Nuclear power contributed 10% to the mix, its lowest December contribution in the past five years and 6 percentage points below both December 2021 & 2022, continuing a multi-year trend of reduced nuclear availability. Solar generation delivered 2% of electricity, the highest December contribution in the past five years, though still modest given seasonal conditions. Storage technologies supplied 2% of the mix, doubling their contribution compared to previous Decembers and marking the strongest December performance to date. This growth highlights ongoing improvements in grid flexibility and battery capacity. Biomass generation accounted for 7%, up from 6% in December 2024, while hydropower remained steady at 3%, consistent with the past three Decembers. Coal remained absent from the generation mix, reinforcing Britain’s continued phase-out of coal-fired power. Zero-Carbon Sources & Carbon Intensity Zero-carbon sources, including wind, solar, nuclear, and hydro, supplied 67% of Britain’s electricity in December 2025. This represents the highest December share in the past five years and an 11 percentage point increase compared to December 2024. Carbon intensity fell further to 120 gCO₂/kWh, improving on December 2024’s 126 gCO₂/kWh and marking the lowest December level across the five-year period. This reduction reflects the combined impact of strong wind generation, increased storage deployment, and reduced gas usage. On a rolling 12-month basis, carbon intensity stood at 129 gCO₂/kWh, slightly higher than the previous year’s rolling average but still significantly lower than levels seen earlier in the decade. Meanwhile, the rolling 12-month average for zero-carbon generation increased to 56%, highlighting continued long-term progress in decarbonising Britain’s electricity system. Concluding Remarks December 2025 capped off a strong year for Britain’s electricity transition. Wind remained the backbone of the generation mix, and the zero-carbon share climbed to a record December high of 67%. These developments helped drive carbon intensity to its lowest December level in five years. However, the continued decline in nuclear output and a sharp rise in electricity imports underline ongoing structural challenges. To maintain momentum toward net zero and strengthen energy security, sustained investment in domestic clean generation, nuclear capacity, and flexible technologies will remain essential as Britain enters the next phase of its energy transition. Britain's Electricity Summary Charts