Carrot or Stick? How carbon price pressure will be a key component to tackling the climate crisis

3 March 2021

What we learn about sustainability from the smoking ban

Dawn photo of a lake reflecting a building and chimney. Bright orange colours with silhouetted reeds.
I was recently thinking about the past. How sometimes public opinion and government action can create a real consensus of change. I remember when smoking was allowed in public places—sitting in restaurants and pubs fogged with cigarette smoke. My kids found this inconceivable when I tried to describe it to them. The ban on smoking in public places came into effect in the UK on 1 July 2007. It has been described as the single most important piece of health legislation in a generation.

What allowed such a sweeping change to our habits and beliefs to occur? 

I think you can put it into 4 categories: Science, Public Opinion, Government Policy and Price. All of these elements combined have, according to ASH (Action on Smoking and Health), driven smoking numbers down from 45% of adults in 1974 to 15% in 2018. 

Let’s consider how these four elements of change will influence the challenge of net zero.

Dawn photo of a lake reflecting a building and chimney. Bright orange colours with silhouetted reeds.

We need carrot and stick to reach net zero

What forces need to combine to lay the foundations of a significant global reduction of carbon emissions? To drive significant change, it's not just one way, it's a number of ways. Let's call it using both the 'carrot and stick'. The global awakening to climate change has been rumbling along for a number of years but we are all aware that within the last twelve months it's gathered into a new pace. 2021 is predicted to be ‘the year of the environment’. 


Let’s go back to our four categories:


Science: Billions of dollars has flowed from governments and private sources to fund climate change research. When an issue sees significant uptake by the public and media channels, governments wake up, and there is a cyclical effect with one driving the other.


Public Opinion: We've seen protests in major cities across the world and the rise of protest movements such as Extinction Rebellion. Apocalyptic imagery fuels media coverage, which has even led to a condition called ‘eco-anxiety’. Climate change is ranked as the most important issue of our time by Generation Z. 


Government Policy: The UK government’s 2008 Climate Change Act and the secondary legislation passed in 2019 commits business and other organisations to net zero carbon emissions by 2050. The UK is currently not on target to meet this goal.


Price: The overlooked category and the one I want to consider. It is a crucial piece of the puzzle.


Dawn photo of a lake reflecting a building and chimney. Bright orange colours with silhouetted reeds.

Price is our stick: how it can drive change in our energy markets

Sometimes the market needs to be driven by purely economics. In the UK we have had a number of carbon taxes/schemes over the years, with two that have had a direct impact on the wholesale price of energy. EU ETS scheme and the Carbon price floor. The first started with an intention of taxing carbon emitting generators and started to do a reasonable job when it was trading at 30 euros a tonne in 2006; but then it crashed because of oversupply and miss calculation, which took the pressure off the energy markets for a number of years. The UK then introduced the carbon floor price in 2013 to make sure the pressure stayed on generators. What inevitably happened was that some of the increases hit customers in the back pocket as the 'tax' filtered into the wholesale commodity markets. But it did succeed because it pushed ‘polluters’ off the grid to be replaced by greener technology—because of pure economics. It was painful, but price pushed change. 


This is merely round one, despite carbon prices rising over 70% in the last twelve months. As painful as it may be price will have to rise even further to stimulate the innovation of carbon free technologies and push, not just energy businesses away from carbon emission, but the global population as a whole. 


This needs to be a careful balancing act because any change to the price of carbon, as we have seen over the last decade, gets pushed through to consumers as it filters into the electricity price. Forcing electricity prices higher, especially when global economies are under strain and unemployment is on the rise, is not an appetising solution. It’s imperative policy makers create incentives and make sure the vulnerable are protected. 


Price does once again need to drive change, with innovators, generators and consumers having a clear view of the future with the opportunities and risks clearly defined. 


If you would like to talk about how to effectively manage risks linked to the carbon market price, please give the edenseven team a call.


Pete Nisbet (Managing Partner, edenseven)

by Doug Mccauley 23 March 2026
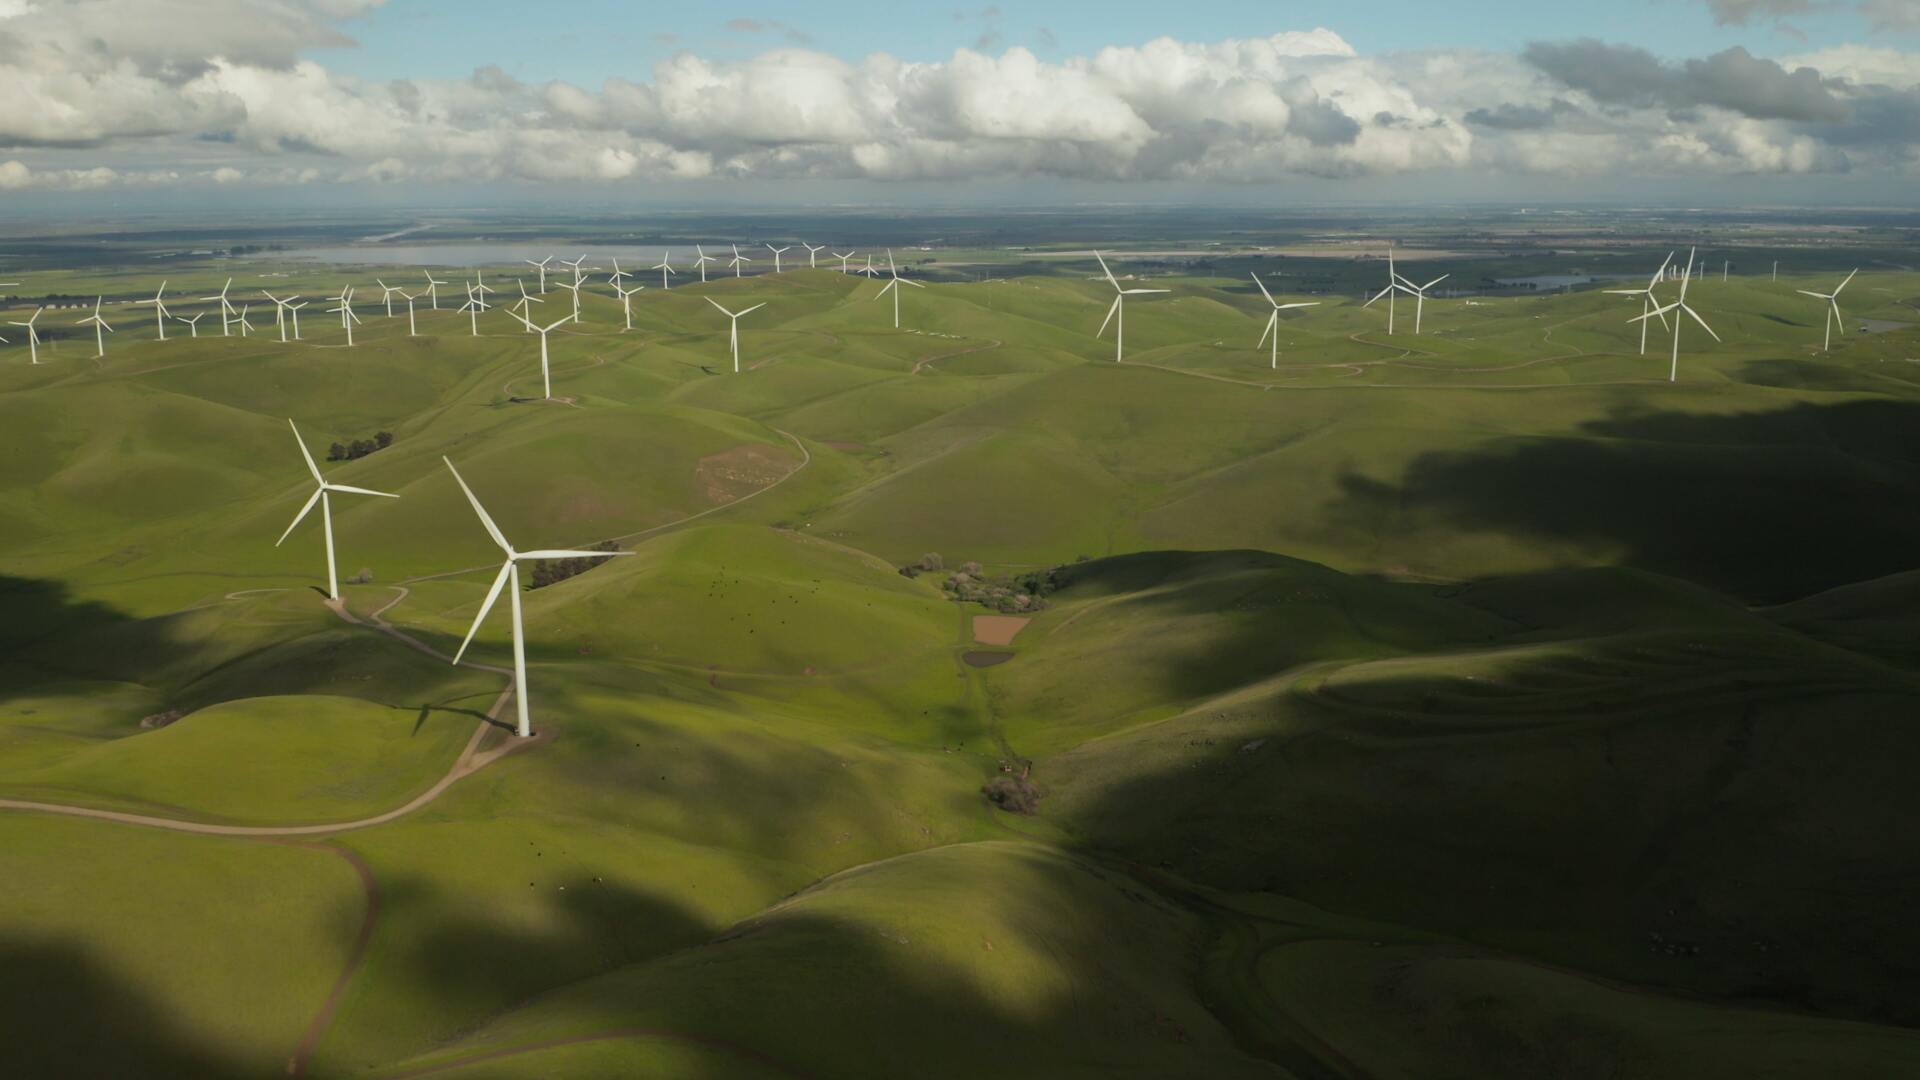
Why the transition to a lower carbon economy is fundamentally about operational resilience. For the past decade, sustainability has steadily moved up the corporate agenda. Boardrooms have become familiar with terms such as net zero, ESG reporting, and climate disclosures. Businesses have been asked to publish targets, measure emissions, and demonstrate progress against a growing range of frameworks. But somewhere along the way, the conversation became overly complicated. For many business leaders, sustainability began to feel less like a commercial strategy and more like a reporting exercise. ESG ratings, disclosure requirements, and long-term commitments increasingly dominated the discussion. In some organisations, this created frustration and fatigue. Leaders struggled to connect sustainability narratives with the practical realities of running a business. Yet the truth is far simpler than the debate suggests. Sustainability is not only about reputation or reporting. Financial returns and resilience are becoming priorities for businesses. Recent global events are reminding us of that reality. The Return of Energy Security For most companies, energy has returned to the centre of strategic decision-making. Recent geopolitical developments have once again exposed how fragile global energy systems can be. Escalating tensions in the Middle East and the resulting conflict involving the United States, Israel, and Iran have already triggered renewed volatility in oil markets. These developments are not isolated shocks; they are part of a broader shift in how global energy markets operate. For a long time now, energy commodity prices have not simply been influenced by supply and demand. They have been shaped by geopolitics, national security concerns, and global power dynamics. For business, this matters enormously. Energy volatility rarely remains confined to commodity markets. It quickly feeds into manufacturing costs, logistics, procurement decisions, and the price of goods and services. Supply chains tighten, inflation rises, and margins come under pressure. This is why energy security has rapidly returned to the board agenda. Leadership teams are now asking themselves the question: How exposed is our business to energy market shocks? Organisations that cannot answer that question clearly are increasingly recognising a deeper vulnerability within their operations. The Sustainability Narrative Lost Its Way At the same time that energy volatility has returned, the sustainability conversation itself has been undergoing a correction. Over the past few years, many businesses experienced what has often been described as ‘ESG fatigue’. Sustainability became associated with reporting frameworks, compliance obligations, and external scrutiny. The narrative grew increasingly complex, while the operational relevance sometimes became less clear. In some cases, sustainability programmes became disconnected from the core drivers of business performance. That disconnect has been exposed by the current global environment. When energy prices surge or supply chains become unstable, businesses quickly rediscover what sustainability was always meant to address: resource security and operational efficiency. The companies navigating this environment most successfully are not necessarily those with the most ambitious climate targets. They are the organisations that have invested in improving how their operations use energy, materials, and resources. They understand that sustainability is not an abstract environmental concept. It is a practical operational strategy. Businesses that use less energy, generate more of their own power, and reduce dependency on volatile commodity markets are fundamentally more resilient. They are also structurally more competitive. Sustainability Is Really About Risk and Competitiveness Seen through the right lens, sustainability is simply another form of risk management. Businesses today operate within a landscape of increasing regulatory scrutiny, rising energy costs, and growing expectations from investors and supply chains. At the same time, climate-related disruptions and geopolitical tensions are introducing new uncertainties into global markets. For many organisations, sustainability risks now intersect directly with core business risks. Energy price exposure can reshape operating margins. Supply chain disruptions can affect product availability and customer relationships. Investor expectations around climate risk can influence access to capital. Even insurance markets are beginning to factor climate resilience into underwriting decisions. Ignoring these realities does not remove the risk. It simply increases exposure. Yet the most interesting aspect of the sustainability transition is that the same actions that reduce risk often strengthen competitiveness. Businesses that improve energy efficiency lower their operating costs. Companies that electrify operations reduce dependency on volatile fossil fuel markets. Organisations that invest in on-site renewable energy gain greater control over their energy supply. In volatile markets, the businesses with the lowest and most stable energy costs will inevitably outperform those that remain exposed to global commodity shocks. This is why investors are increasingly shifting their focus. Rather than simply assessing climate commitments, they are looking at something far more fundamental: transition readiness and operational resilience. The Companies That Win Will Have Structurally Lower Costs The transition to a lower-carbon economy will not unfold evenly across industries. Some sectors will move faster than others, and the pace of policy change will continue to vary between regions. But one outcome is already becoming clear. The companies that succeed in this transition will have structurally lower energy, material and carbon costs than their competitors. They will operate with more efficient processes, smarter infrastructure, and more resilient supply chains. They will generate a greater share of their own energy and rely less on volatile global commodity markets. In other words, they will have fundamentally stronger business models. This is where the sustainability conversation needs to return. For too long, sustainability has been framed primarily as a reputational issue or a long-term climate commitment. While those elements remain important, they are not the primary reason why businesses are engaging with sustainability today. The real driver is economics. Energy, materials, and resources underpin every industry. Businesses that can secure them more efficiently and manage them more intelligently will always have a competitive advantage. In that sense, sustainability is not separate from business strategy. It is becoming the strategy. As global markets continue to evolve, leadership teams face a defining question. Will sustainability remain a reporting exercise within their organisation, driven by compliance and external expectations? Or will it become a strategic tool used to strengthen resilience, reduce costs and secure long-term competitiveness? The companies that answer that question early are already positioning themselves differently. In a volatile world, operational resilience may prove to be the most valuable asset a business can build. Supporting Organisations Through The Transition At edenseven, we work with organisations that want to approach sustainability as a strategic opportunity rather than simply a reporting requirement. Our focus is on helping leadership teams understand how sustainability connects directly to operational resilience, energy strategy and long-term cost competitiveness. This means looking beyond frameworks and targets to focus on the practical decisions that shape business performance: energy infrastructure, resource efficiency, supply chain resilience, and credible transition planning. The organisations that will lead the transition are not necessarily those making the loudest commitments. They are the ones building structurally stronger and more resilient operations. If you would like to explore how sustainability can strengthen your organisation’s operational resilience and competitive positioning, we would welcome the opportunity to start that conversation. Speak to a member of the edenseven team today!
by Doug Mccauley 17 March 2026
Fuel Type Breakdown Britain’s electricity generation in February 2026 was led by wind, which contributed 36% of the energy mix. While slightly below the 40% recorded in February 2022, this represents strong performance and a 4 percentage point increase compared to February 2025. February 2026 also marked the seventh consecutive month that wind has been Britain’s dominant source of electricity, outpacing gas, reinforcing its position at the centre of the country’s power system. Gas supplied 29% of electricity in February 2026, down from 33% in February 2025, but still a significant contributor to the overall mix. This reduction reflects continued progress in limiting fossil fuel reliance. Electricity imports accounted for 12% of the generation mix, unchanged from February 2025 and broadly consistent with recent years. This sustained level highlights the ongoing role of interconnectors in supporting system stability. Nuclear power contributed 11%, slightly down from 12% in February 2025 and continuing the trend of reduced nuclear availability compared to earlier in the decade. Biomass generation remained steady at 7%, providing a reliable source of low-carbon, dispatchable power. Solar output contributed 2%, in line with seasonal expectations and unchanged from the previous year. Storage technologies increased their contribution to 2%, up from 1% in February 2025 and marking the highest February share on record. This reflects continued growth and the increasing importance of battery & storage assets in managing system flexibility. Hydropower fell to 1%, down from 2% in February 2025, representing one of the lowest February contributions in recent years. Coal remained absent from the generation mix, following its removal from Britain's electricity generation in 2024. Zero-Carbon Sources & Carbon Intensity Zero-carbon sources, including wind, solar, nuclear, and hydro, generated 63% of Britain’s electricity in February 2026. This marks the highest February share in the past six years and a 15 percentage point increase compared to February 2025. Carbon intensity declined to 136 gCO₂/kWh, 7% cleaner than the 147 gCO₂/kWh in February 2025 and continuing the broader downward trend compared to historical levels. This reduction reflects stronger renewable generation, particularly from wind, alongside lower gas usage. On a rolling 12-month basis, carbon intensity stood at 128 gCO₂/kWh, slightly higher (2%) than the previous period but still significantly below levels seen earlier in the decade. Meanwhile, the rolling 12-month average for zero-carbon generation rose to 59%, indicating continued progress in decarbonising Britain’s electricity system. Concluding Remarks  February 2026 continued the positive momentum seen at the start of the year. Wind remained the dominant generation source for a seventh consecutive month, and notably, February 2026 also marked the seventh consecutive month of renewable-dominated electricity generation in Britain. Zero-carbon output exceeded 60%, while carbon intensity declined year-on-year. Despite this progress, gas continues to play a key role in balancing the system during winter months, while nuclear output remains below historic levels and imports continue to support supply. Looking ahead, maintaining strong renewable performance, alongside further investment in storage and firm low-carbon capacity, will be essential to sustaining emissions reductions and strengthening Britain’s long-term energy resilience. Britain's Electricity Summary Charts
wind turbines at sunset with text
by Doug Mccauley 3 March 2026
edenseven are following trends in the renewable energy sector closely, as decarbonising the energy sector is vital for ensuring a sustainable future and achieving Net Zero. Considering the recent DESNZ quarterly update of the renewable energy planning database, we have produced a consolidated summary of projects in the United Kingdom that have received planning permission. We will continue to release updates each quarter. Key Insights: In the 12 months to the end of Q4 2025, the UK approved 677 solar PV projects, a 14% year-on-year increase and the second-highest rolling 12-month total on record. Together, these projects will deliver a record 6,075 MW of capacity, 37% more than the previous peak year in 2023. 2025 was a landmark year for UK offshore wind. Eight projects were approved, unlocking a record-breaking 9,900 MW of capacity, nearly double the previous peak set in 2015 and almost seven times the 1,282 MW approved in 2024. Onshore wind approvals rose to 56 projects. While this ranks only eighth by project count, their combined capacity of 1,734 MW is the second-highest total on record.
by Doug Mccauley 6 February 2026
Fuel Type Breakdown Britain’s electricity generation in January 2026 was led by wind, which supplied 37% of the energy mix. This marks a strong rebound from the 27% recorded in January 2025 and represents the highest January contribution in the past five years. Wind outperformed gas by 6 percentage points, reinforcing its growing role as the backbone of winter electricity generation. Gas accounted for 31% of electricity generation in January 2026, down from 38% in January 2025 but still reflecting its continued role in meeting peak winter demand. Despite the year-on-year decline, gas remained the second-largest source of generation during the month. Electricity imports contributed 11% of the generation mix, slightly lower than January 2025 but broadly in line with recent winters. This continued reliance on imports highlights the importance of interconnectors in balancing domestic supply during periods of high demand. Nuclear power supplied 10% of electricity, down from 12% in January 2025 and well below levels seen earlier in the decade. This ongoing reduction reflects the continued decline of nuclear electricity generation in Britain. Biomass generation increased to 7%, up from 6% in January 2025, providing a stable source of dispatchable low-carbon power. Solar generation contributed 2%, consistent with recent January levels and reflecting limited seasonal output. Storage technologies supplied 2% of the mix, matching January 2025 and marking the joint-highest January contribution on record. This continued growth highlights the increasing importance of battery and storage assets in managing system flexibility. Hydropower remained steady at 2%, consistent with recent January performance. Coal remained absent from the generation mix, following its removal from Britain’s electricity generation in 2024. Zero-Carbon Sources & Carbon Intensity Zero-carbon sources, including wind, solar, nuclear and hydro, delivered 61% of Britain’s electricity in January 2026. This represents a significant improvement on January 2025’s 43% and the highest January share in the past five years. Carbon intensity fell to 144 gCO₂/kWh, a notable reduction (14%) compared with 168 gCO₂/kWh in January 2025 and broadly in line with January 2023 levels. This improvement reflects the stronger contribution from wind, storage and biomass alongside reduced gas generation. On a rolling 12-month basis, carbon intensity stood at 129 gCO₂/kWh, slightly higher than the previous rolling period but still well below historical averages. Meanwhile, the rolling 12-month average for zero-carbon generation increased to 57% (up by 6 percentage points), underlining continued long-term progress in decarbonising Britain’s electricity supply. Concluding Remarks January 2026 marked a strong start to the year for Britain’s electricity transition. Wind reclaimed its position as January's leading power source, following two years of gas-led January generation. Zero-carbon generation exceeded 60%, and carbon intensity fell sharply compared to the previous January. However, gas continued to play a significant role in meeting winter demand, while nuclear output remained subdued, and imports continued to play a large role in supporting system balance. Sustaining progress through the remainder of the year will depend on maintaining high renewable output, accelerating storage deployment, and further reducing our reliance on fossil-fuel-sourced energy. Britain's Electricity Summary Charts
Electricity pylon against amber sky, with text
by Doug Mccauley 28 January 2026
Finding 1: Wind Energy Dominated Britain's Electricity Generation in 2025 In 2025, wind energy was Britain’s largest source of electricity generation, supplying around a third (30%) of total electricity. Wind now makes up almost 10% more of Britain's electricity mix than it did in 2021, underscoring its role as the backbone of Britain’s electricity system (figures 1 & 2). Finding 2: Gas Levels Have Fallen Dramatically Since 2021 Gas generation declined by almost 15%, falling from 39% of Britain’s electricity mix in 2021 to 26% in 2025. After a sharp decline between 2021 and 2024, gas output stabilised in 2025, indicating a new, lower baseline for fossil-fuel generation (figures 1 & 2). Finding 3: Coal Absent from Britain's Electricity Mix in 2025 Coal’s share of generation fell from 2% in 2021 to 0% in 2025, making 2025 the first full year with no electricity generation in Britain from coal. This is a major milestone for Britain’s electricity decarbonisation and a significant step to reduce emissions (figures 1 & 2). Finding 4: Solar, Storage, and Imports Played a Growing Role Between 2021 and 2025, solar generation increased from supplying 4% of Britain's electricity, to 7% in 2025, while storage has doubled from 1% to 2% in 2025. Over the same period, imported energy has risen from 10% to 15% of Britain's electricity mix, highlighting a strong need to balance domestic low-carbon generation and improve grid flexibility (figures 1 & 2).
by Doug Mccauley 15 January 2026
Fuel Type Breakdown Britain’s electricity generation in December 2025 was once again led by wind, which supplied 38% of the energy mix. While slightly below the 39% recorded in December 2024 and the 41% peak in December 2023, wind maintained its dominant position and continued to outperform all other generation sources. Wind generation exceeded gas output by 13 percentage points, underlining its central role in Britain’s winter electricity supply. Gas accounted for 25% of electricity generation in December 2025, its lowest December share in the past five years, and 13 percentage points below December 2021. This continued decline highlights sustained progress in reducing reliance on fossil fuels, particularly during peak winter demand. Electricity imports rose to 15% of the generation mix, the highest December share over the past five years and up 5 percentage points year-on-year. This increase reflects growing reliance on cross-border electricity flows to support domestic supply during periods of high demand. Nuclear power contributed 10% to the mix, its lowest December contribution in the past five years and 6 percentage points below both December 2021 & 2022, continuing a multi-year trend of reduced nuclear availability. Solar generation delivered 2% of electricity, the highest December contribution in the past five years, though still modest given seasonal conditions. Storage technologies supplied 2% of the mix, doubling their contribution compared to previous Decembers and marking the strongest December performance to date. This growth highlights ongoing improvements in grid flexibility and battery capacity. Biomass generation accounted for 7%, up from 6% in December 2024, while hydropower remained steady at 3%, consistent with the past three Decembers. Coal remained absent from the generation mix, reinforcing Britain’s continued phase-out of coal-fired power. Zero-Carbon Sources & Carbon Intensity Zero-carbon sources, including wind, solar, nuclear, and hydro, supplied 67% of Britain’s electricity in December 2025. This represents the highest December share in the past five years and an 11 percentage point increase compared to December 2024. Carbon intensity fell further to 120 gCO₂/kWh, improving on December 2024’s 126 gCO₂/kWh and marking the lowest December level across the five-year period. This reduction reflects the combined impact of strong wind generation, increased storage deployment, and reduced gas usage. On a rolling 12-month basis, carbon intensity stood at 129 gCO₂/kWh, slightly higher than the previous year’s rolling average but still significantly lower than levels seen earlier in the decade. Meanwhile, the rolling 12-month average for zero-carbon generation increased to 56%, highlighting continued long-term progress in decarbonising Britain’s electricity system. Concluding Remarks December 2025 capped off a strong year for Britain’s electricity transition. Wind remained the backbone of the generation mix, and the zero-carbon share climbed to a record December high of 67%. These developments helped drive carbon intensity to its lowest December level in five years. However, the continued decline in nuclear output and a sharp rise in electricity imports underline ongoing structural challenges. To maintain momentum toward net zero and strengthen energy security, sustained investment in domestic clean generation, nuclear capacity, and flexible technologies will remain essential as Britain enters the next phase of its energy transition. Britain's Electricity Summary Charts
by Doug Mccauley 19 December 2025
edenseven are following trends in the renewable energy sector closely, as decarbonising the energy sector is vital for ensuring a sustainable future and achieving Net Zero. Considering the recent DESNZ quarterly update of the renewable energy planning database, we have produced a consolidated summary of projects in the United Kingdom that have received planning permission. We will continue to release updates each quarter. Key Insights: In the 12 months to the end of Q3 2025, the UK approved 710 solar PV projects, up 6% year on year and the second-highest 12-month total ending Q3. These approvals will deliver a record 5,448 MW of solar capacity. Offshore wind approvals doubled to 8 projects, set to deliver a record 9,900 MW. Meanwhile, onshore wind approvals fell to 42 projects, though total capacity rose to 1,039 MW, driven by larger average project sizes.
by Doug Mccauley 17 December 2025
Fuel Type Breakdown Britain's electricity generation in November 2025 was led by wind, which contributed 37% of the energy mix. This represents the highest November share in the past five years, up 10 percentage points compared to November 2024. Wind also outpaced gas generation by 10 percentage points, reinforcing its role as the dominant power source. Gas supplied 27% of electricity in November 2025, marking its lowest November contribution over the last five years. This decline underscores ongoing progress in reducing reliance on fossil fuels and highlights the shifting balance towards renewable energy. Electricity imports accounted for 11% of the generation mix, unchanged from November 2024 but slightly below the 12% seen in November 2023. This continued reliance on cross-border electricity reflects the need to balance intermittent domestic supply. Nuclear power contributed 10% of the mix, down from 12% in both November 2023 and November 2024, and 6% below the level seen in November 2021, continuing a trend of reduced nuclear availability. Solar generation provided 2% of Britain’s electricity, down from 4% in November 2024, but largely consistent with the previous years, indicating stable, though modest, contributions from solar during autumn. Storage technologies supplied 2% of the mix, up 1 percentage point compared to November 2024, marking the highest November contribution in the past five years. This increase signals improvements in grid flexibility and battery deployment. Biomass contributed 8%, up slightly from 7% in November 2024, while hydropower remained steady at 2%, consistent with levels over the previous five years. Coal remained absent from the generation mix, continuing Britain’s phasing out of coal-fired power. Zero-Carbon Sources & Carbon Intensity Zero-carbon sources, including wind, solar, nuclear and hydro, delivered 66% of Britain’s electricity in November 2025, the highest November share in the past five years and a significant 24 percentage points higher than November 2024. Carbon intensity fell sharply to 126 gCO₂/kWh in November 2025, a marked reduction compared to 171 gCO₂/kWh in November 2024 and the lowest November level in the past five years. On a rolling 12-month basis, carbon intensity remained low at 129 gCO₂/kWh, slightly higher than the previous period but still reflecting the impact of increased renewable generation. The rolling 12-month average for zero-carbon generation is 55%, 4% higher than the previous 12-month period, highlighting steady long-term growth in low-carbon electricity sources. Concluding Remarks November 2025 was a strong month for Britain’s electricity transition. Wind delivered record November output, storage continued to support grid flexibility, and the zero-carbon share reached an all-time November high of 66%. Carbon intensity dropped to its lowest November level in five years, underlining the tangible benefits of renewables and flexible technologies. Despite these gains, nuclear output remained lower than in previous years, and imports continued to play a role in balancing supply. To sustain momentum towards net zero, ongoing investment in domestic clean energy generation, storage, and flexible grid technologies remains essential. Britain's Electricity Summary Charts
by Doug Mccauley 21 November 2025
Fuel Type Breakdown Britain's electricity generation in October 2025 was led by wind, which contributed 34% of the energy mix, matching its share from October 2023 but below the 36% recorded in October 2022. This represented a 3 percentage point increase compared to October 2024 and outpaced gas generation by 5 percentage points, reinforcing wind's position as a leading power source. Gas, meanwhile, supplied 29% of electricity in October 2025, marking its second-lowest October contribution in the past five years. This decline highlights ongoing progress in reducing reliance on fossil fuels. Electricity imports accounted for 14% of Britain's generation mix, up 3 percentage points compared to October 2024 and the highest October share in the past five years. This sustained level reflects continued dependence on cross-border electricity flows to balance domestic supply. Nuclear power contributed 10% to the mix, down from 13% in October 2024 and below the 14% seen in 2021, 2022 & 2023. This marks a continued period of reduced nuclear availability. Solar generation delivered 3% of Britain's electricity in October 2025, consistent with October 2023 and October 2021 but 1 percentage point lower than in October 2024 and October 2022. Storage technologies supplied 2% of the mix, up 1 percentage point year-on-year and the highest October contribution in the past five years, signalling ongoing improvements in grid flexibility and battery capacity. Biomass contributed 6% to the mix, 2 percentage points lower than in October 2024. Hydropower remained steady at 2%, largely consistent with October levels across the previous five years. Coal remained absent from the generation mix, continuing Britain's phase-out of coal-fired power. Zero-Carbon Sources & Carbon Intensity Zero-carbon sources, including wind, solar, nuclear, and hydro, delivered 61% of Britain's electricity in October 2025, the highest October share of the previous five years and 10 percentage points higher than in October last year. Carbon intensity for October 2025 remained static compared to October in the previous two years at 138 gCO₂/kWh. This stagnation suggests that more effort is needed to decarbonise Britain's electricity to ensure continued progress towards net zero. Over the longer term, the 12-month rolling average for zero-carbon generation increased by 1% over the previous 12-month period, to 53%. In contrast, the rolling average carbon intensity rose by 8% to 133 gCO₂/kWh compared with the previous 12 months, signalling the importance of accelerating clean energy deployment to sustain downward momentum. Concluding Remarks October 2025 marked a relatively good month for Britain's renewable generation, with wind maintaining its position as the leading power source, though falling short of the 36% achieved in October 2022. Together with growing storage capacity, these sources helped sustain low carbon intensity levels. However, the decline in nuclear generation and continued reliance on imports highlight the need for further investment in domestic clean energy infrastructure and flexible technologies. While progress in storage and renewable deployment is evident, maintaining long-term momentum will be essential to achieving sustained reductions in carbon intensity towards net zero and strengthening Britain's energy resilience. Britain's Electricity Summary Charts
by Doug Mccauley 20 November 2025
PRESS RELEASE FOR IMMEDIATE RELEASE 20th November 2025 UK Corporate Accountability Exposed as Climate Commitments Fail to Deliver New Report Reveals FTSE250 Generates 37% of Global Aviation’s Carbon Footprint