Britain's Electricity Generation - Annual Review
Finding 1: Wind Energy Dominated Britain's Electricity Generation in 2024
In 2024, Wind energy was the primary source of electricity generation in Britain, contributing 30% to the energy mix, surpassing gas, which accounted for 26% (figure 1).
Finding 2: Wind Energy Increased While Gas Declined
Over the past four years, the share of wind energy in Britain's electricity mix steadily rose from 21% in 2021 to 30% in 2024. Meanwhile, gas saw a significant decline, decreasing from 39% of the mix in 2021 to 26% in 2024. The drop in gas has been partly compensated by the rise in wind energy, but there has also been a 4% increase in imports compared to 2021, along with a rise in hydro and solar energy. The contribution from nuclear energy remained largely unchanged, with a 1% decline in its share of the electricity mix from 2021 to 2024 (figure 1 & 2).
Finding 3: Coal Phased Out in 2024
Coal production decreased from 2% in 2021 to 1% in 2024 and is expected to contribute 0% in 2025, following the closure of the last coal-fired power station, Ratcliffe, at the end of September 2024
(figure 1 & 2).
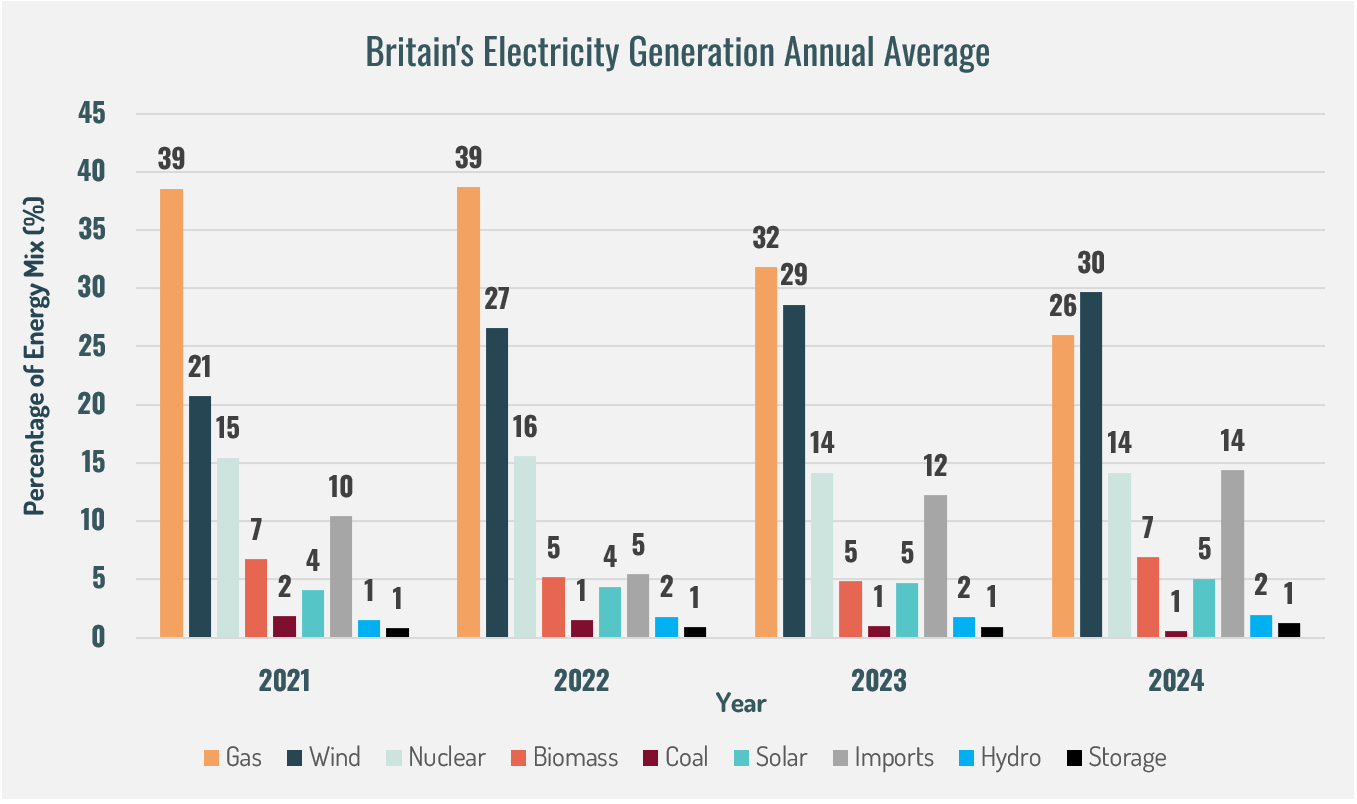
Figure 1: Britain's electricity generation by energy source (2021-2024). - Data Source: National Grid ESO.
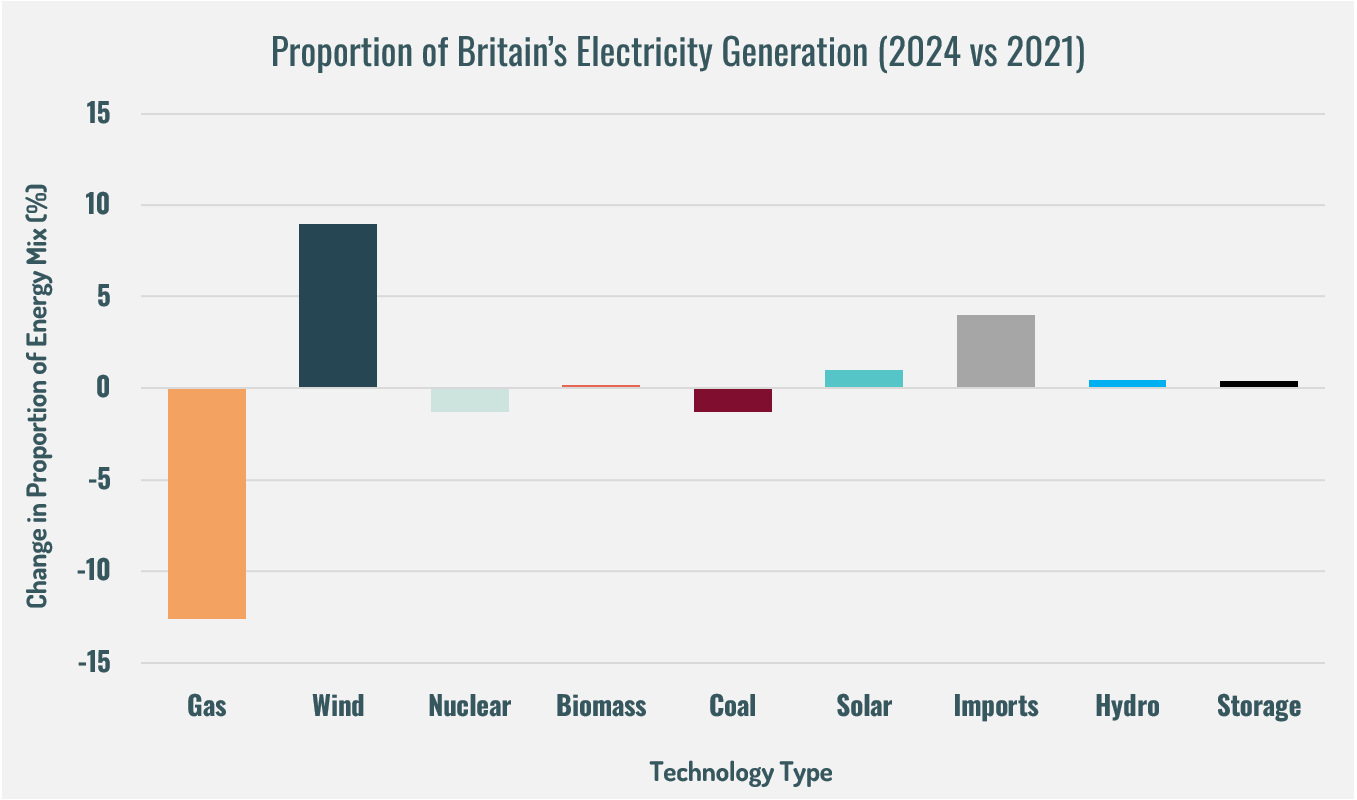
Figure 2: Change in proportion of Britain's electricity generation by energy source (2024 vs 2021). - Data Source: National Grid ESO.
Finding 4: 2024 Was the Cleanest Year in the Last Four Years
Since 2021, the carbon intensity of Britain's electricity generation has decreased by 34%, or 63 gCO₂/kWh, falling from an annual average of 188 gCO₂/kWh in 2021 to 125 gCO₂/kWh in 2024 (figure 3).
Finding 5: 2024 Had the Highest Share of Zero-Carbon Sources in the Last Four Years
The proportion of zero-carbon energy sources in Britain's electricity generation has steadily increased. From 43% in 2021, zero-carbon sources rose to 51% in 2024, reflecting an 8% increase (figure 3).
Figure 3: Carbon intensity and proportion of electricity generation from zero-carbon sources for Britain's electricity generation (2021-2024). - Data Source: National Grid ESO.
Finding 6: Q2 2024 Was the Cleanest Quarter in the Last Four Years
Q2 2024 recorded the lowest carbon intensity of the last four years for Britain's electricity generation at 105 gCO₂/kWh, which was 51% cleaner than the most carbon-intensive quarter, Q3 2022, which had a carbon intensity of 213 gCO₂/kWh (figure 4).
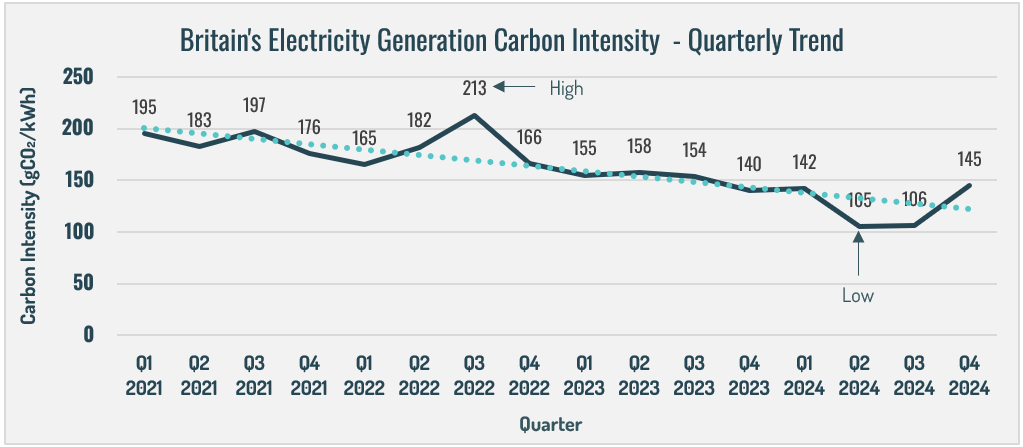
Figure 4: Carbon intensity of Britain's electricity generation by quarter (2021-2024). - Data Source: National Grid ESO.
Finding 7: August 2024 Was the Cleanest Month in the Last Four Years
August 2024 was the cleanest month in the last four years, achieving a carbon intensity of just 83 gCO₂/kWh. This was 62% cleaner than August 2022, which had the highest carbon intensity at 220 gCO₂/kWh (figure 5).
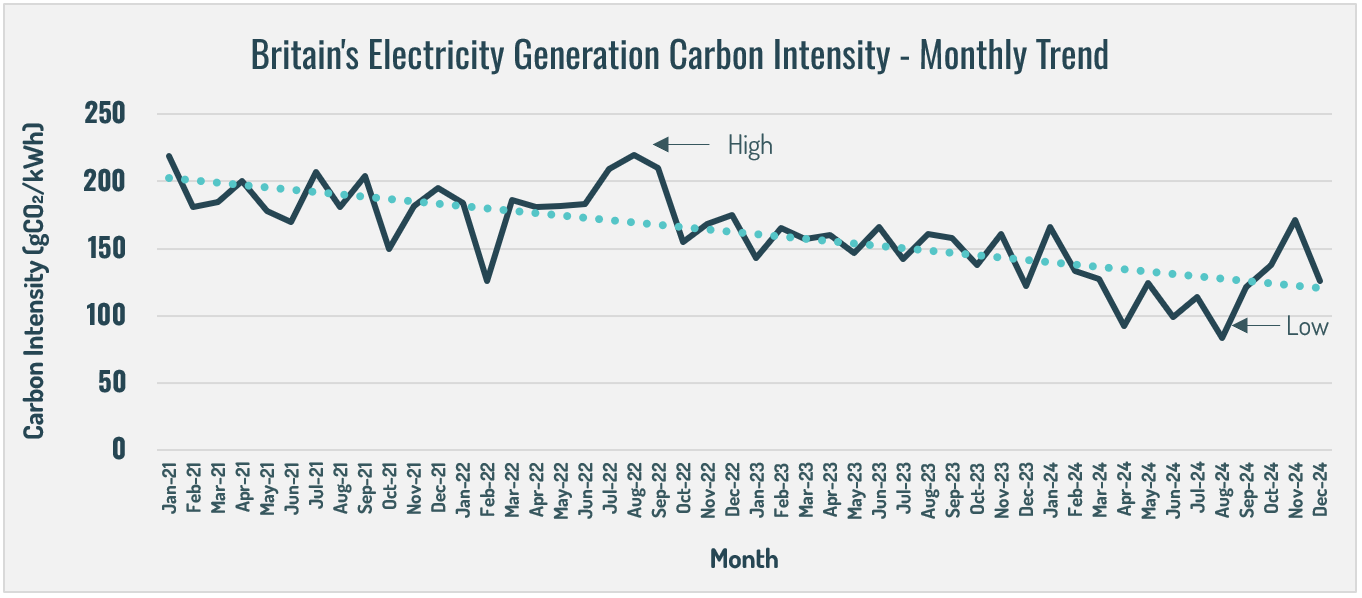
Figure 5: Carbon intensity of Britain's electricity generation by month (2021-2024). - Data Source: National Grid ESO.
Finding 8: Q4 2023 Had the Highest Proportion of Generation from Zero-Carbon Sources
The quarter with the highest contribution from zero-carbon sources in the last four years was Q4 2023, during which zero-carbon sources accounted for 54% of Britain's electricity generation. This was a 16% increase compared to Q3 2021, when zero carbon sources contributed only 38%, the lowest of the last four years (figure 6).

Figure 6: Percentage of Britain's electricity generation sourced from zero-carbon sources by quarter (2021-2024). - Data Source: National Grid ESO.
Finding 9: 2022, 2023, and 2024 Featured Months with the Highest Proportion of Electricity from Zero-Carbon Sources
The months with the highest contribution from zero-carbon sources in the last four years were February 2022, December 2023, and August 2024, each achieving 60% of electricity from zero-carbon sources. This was 26% higher than July 2021, which had the lowest share of the past four years at 34% (figure 7).
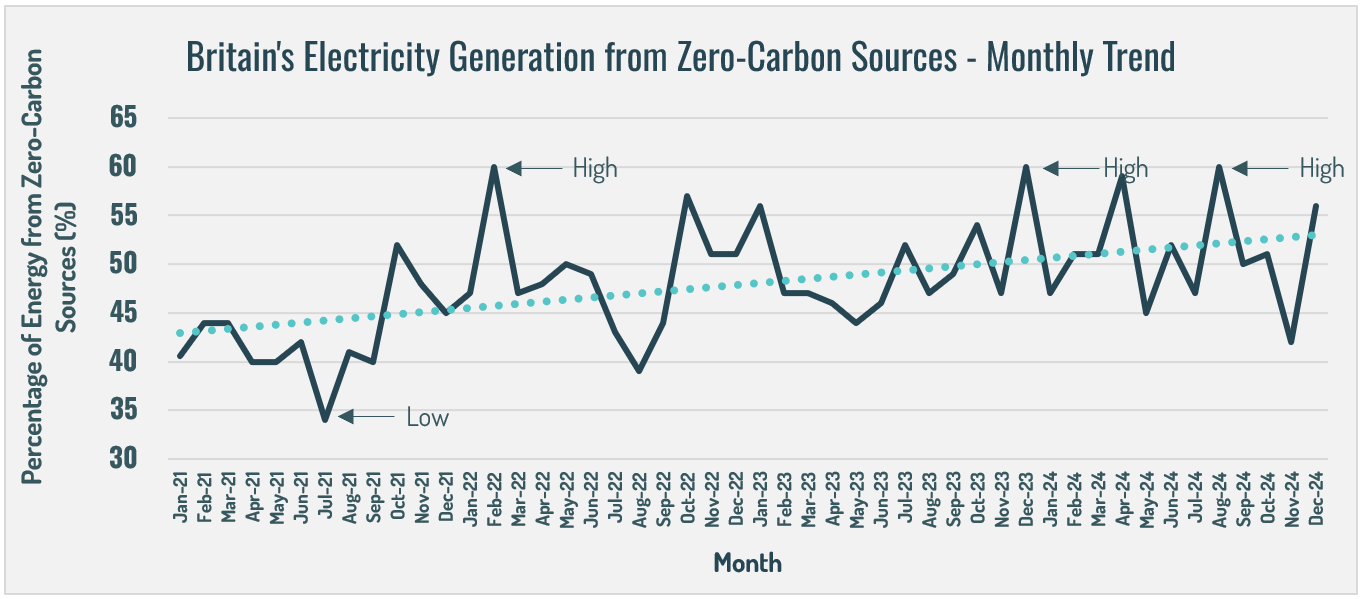
Figure 7: Percentage of Britain's electricity generation sourced from zero-carbon sources by month (2021-2024). - Data Source: National Grid ESO.
Finding 10: 2025 Is Projected to See Average Carbon Intensity Fall to 103 gCO₂/kWh
Since 2021, the carbon intensity of Britain's electricity mix has declined by an average of 15% or 21 gCO₂/kWh per year. Based on this trend, it is projected that the average carbon intensity in 2025 will be approximately 103 gCO₂/kWh (figure 8).
Finding 11: 2025 Is Projected to See Zero-Carbon Sources Deliver 54% of the Electricity Mix
Zero-carbon sources have shown an average annual increase of 3% since 2021. Based on this trend, it is estimated that, in 2025, zero-carbon sources will contribute 54% of the electricity mix (figure 8).
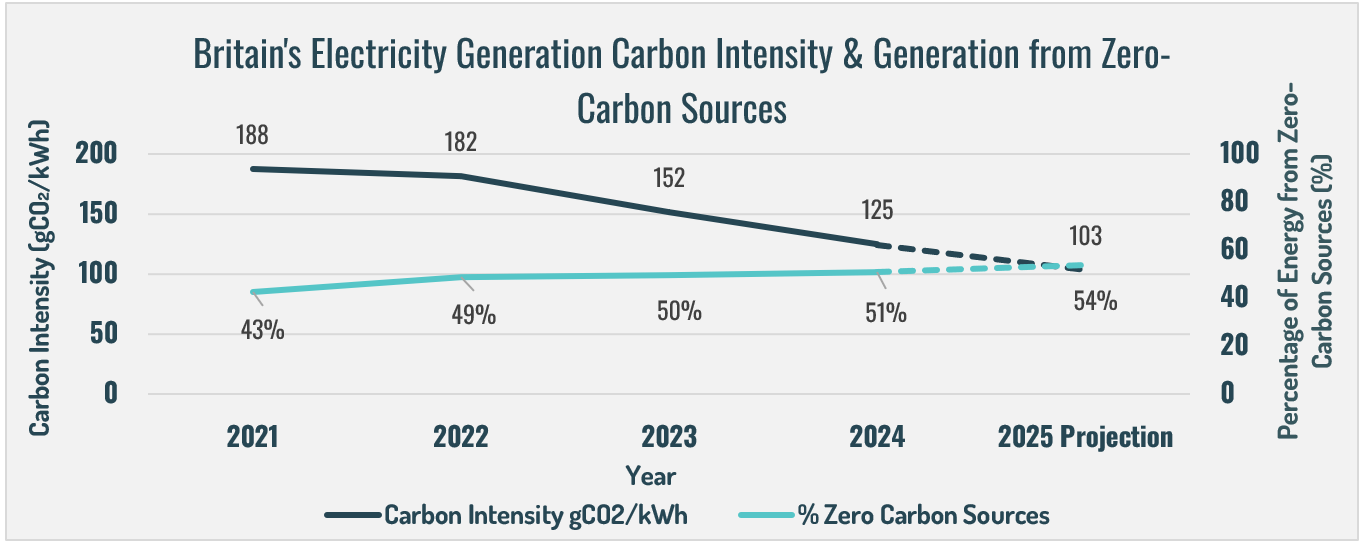
Figure 8: Carbon intensity and proportion of electricity generation from zero-carbon sources for Britain's electricity generation (2021-2025). - Data Source: National Grid ESO.
Increasing electricity generation from renewable sources is essential for achieving our net-zero goals, ensuring energy security, and reducing reliance on imports.
To view our interactive renewables map,
click here
Data source: National Grid ESO 2025
(https://www.nationalgrideso.com/electricity-explained/electricity-and-me/great-britains-monthly-electricity-stats)
