Blog Layout

What does a tonne of CO2 look like?

25 August 2022
As part of our work developing sustainability strategies, we often help clients to quantify their Scope 1 (direct), Scope 2 (electricity) and Scope 3 (indirect) carbon emissions. 

As part of your overall sustainability strategy, it is very important to include and communicate your wins with all employees. They should be invested in your goals and be encouraged to contibute. 

However, as with many environmental narratives, it can be hard to conceptualise. CO2 is particularly hard to visualise in way that is easily understandable in context: we do not associate volume to a measurement of mass/weight easily.


Carbon Visuals

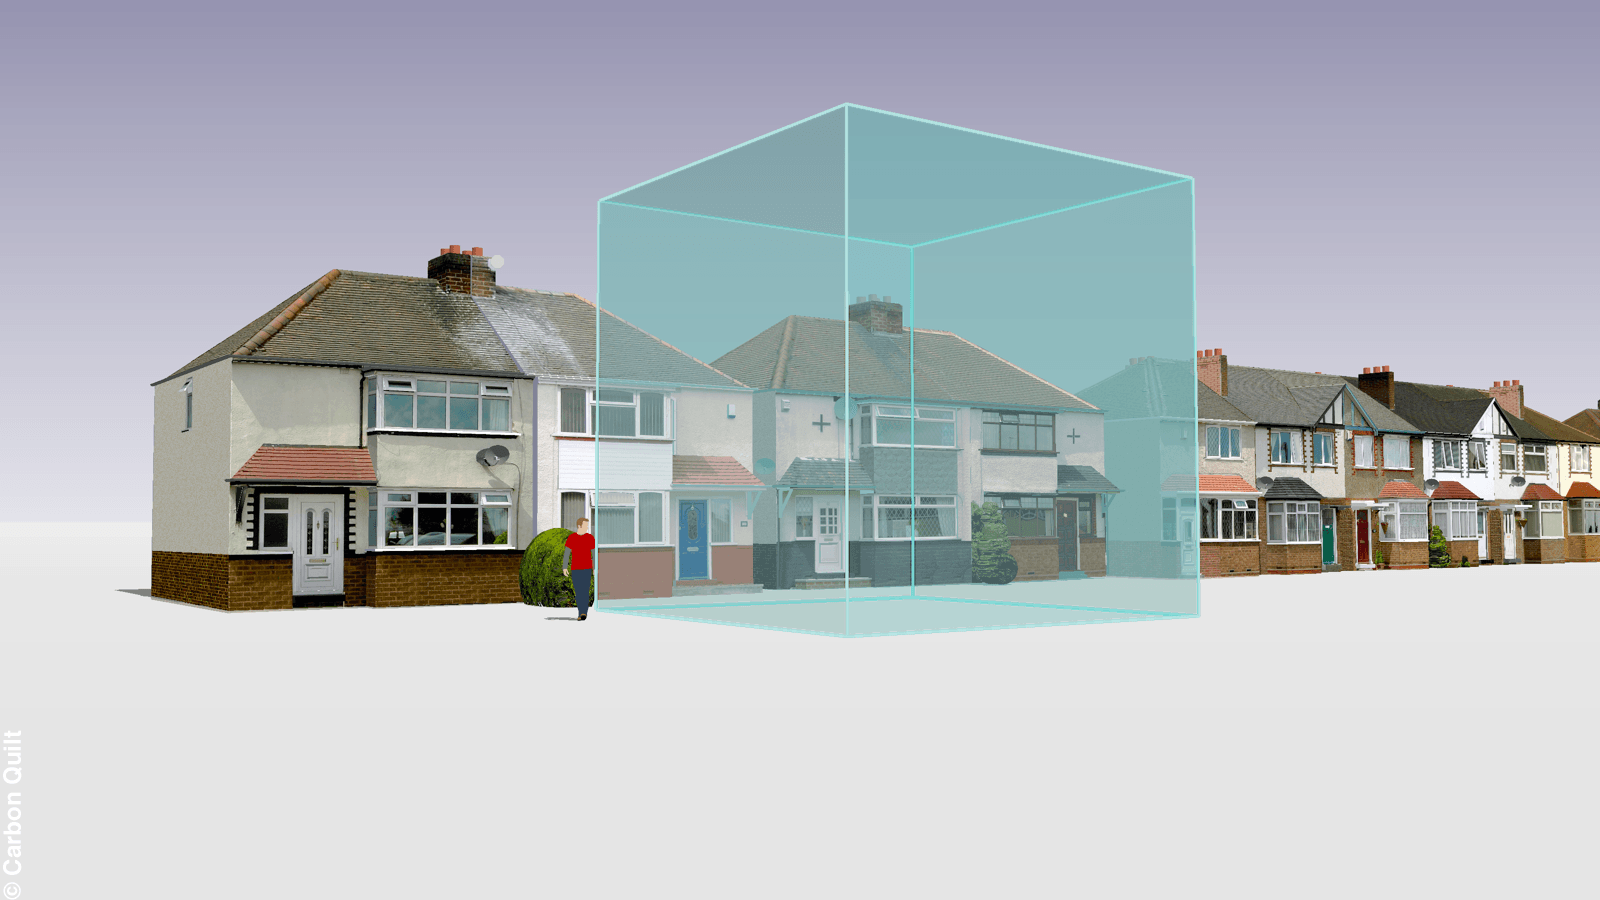
There is a useful way to visualise one tonne of CO2—using graphics like those from Carbon Visuals. One unit is equal to one cube of 8m by 8m filled with CO2, at 15 degrees Celsius and sea level pressure. You can see how this looks in the image below: 

The average carbon footprint per person in the UK is estimated to be around 12 tonnes of CO2 per annum. Therefore, each of us are on average, per year, producing 12 cubes of CO2 like the one in the illustration.

Translating CO2 into activities 

Another way to understand emissions is by translating carbon emissions into other activities that are easier to understand. To help organisations communicate their carbon footprint, we have deployed a tool on our website developed by EPA (USA Environment Protection Agency) that translates greenhouse gas emissions or energy consumption into some equivalences (based on US metrics and data).


For example, one tonne of CO2 is equivalent to:


  • 2,500 miles driven by an average gasoline-powered passenger vehicle 
  • 120,000 smartphones charges
  • 500 litres of Diesel consumed
  • Just over 0.5 kilograms of HCFC-22 (commonly used in domestic and commercial refrigeration and air condition) released to the atmosphere   


Presented as infographics, your data can be shared with stakeholders in ways that have much greater impact and emotional resonance. Communicating your sustainability strategy regularly is a vital pillar of success. If your major stakeholders, including your staff, are not invested in the process it will be harder to achieve results and you will not reap the full extent of reputational benefits in the future.


Feel free to try the EPA tool below and explore the equivalence of your energy consumption.

Sunset sky with distant electricity pylons and text
by Doug Mccauley 16 January 2025
A review of Britain's electricity generation over the past four years, including the contributing energy sources, carbon intensity, proportion of zero-carbon sources and further insights.
Electricity pylon against cloudy sky with snow-covered ground
by Doug Mccauley 10 January 2025
In December 2024, wind energy accounted for the highest proportion of Britain’s electricity mix among all energy types, contributing 39%. Gas contributed 29%, which was a 3% increase from December 2023. Although wind's contribution was higher than in December 2021 and 2022, it was 2% below the 41% recorded in December 2023. Imports reached their highest level for December in the past four years, supplying 10% of Britain’s electricity mix, which is 3% more than in December 2023. Contributions from biomass, hydro, solar and storage remained stable compared to December 2023, providing 6%, 3%, 1% and 1%, respectively. Nuclear energy saw a 2% decrease in its contributions, delivering 12% of the mix in December 2024, the lowest level for December in the past four years. Coal contributed 0% after its phaseout from Britain's electricity generation in September of the previous year. Zero-carbon sources comprised 56% of Britain's electricity generation, marking the second highest level for December in the last four years; however, 4% lower than for December in the previous year. Despite this decline, the rolling 12-month average for zero-carbon sources was 51%, the highest of the last four years. The carbon intensity of electricity generation in December 2024 was 126 gCO₂/kWh, representing a 3% increase compared to December of the previous year. However, the rolling 12-month average was 125 gCO₂/kWh, indicating a 17% reduction compared to the previous 12-months and the lowest level in four years, reflecting ongoing decarbonisation efforts. Increasing electricity generation from renewable sources is essential for achieving our net-zero goals, ensuring energy security, and reducing reliance on imports.
Electricity pylon in a woodland in mist
by Doug Mccauley 16 December 2024
In November 2024, gas was Britain's primary electricity source, accounting for 38% of the mix, a 7% increase from November 2023. Wind energy contributed 27%, 4% lower than the previous year, marking its lowest November share in four years. Nuclear, biomass, solar, and hydro maintained their contributions from 2023 at 12%, 7%, 2%, and 2%, respectively. Nuclear's share was 4% below November 2021, the lowest in four years. Coal contributed 0% after the closure of the last coal-fired power plant, Ratcliffe, in September, while imports provided 11%, the second-highest November level in four years. Zero-carbon sources made up 42% of Britain's electricity generation, the lowest for November in four years and 5% lower than last year. However, the rolling 12-month average for zero-carbon sources is 51%, the highest in the same period. The carbon intensity of electricity generation in November 2024 was 171 gCO₂/kWh, an increase of 6% from November in the previous year. The rolling 12-month average dropped to 124 gCO₂/kWh, marking a 21% reduction and the lowest level in four years, reflecting ongoing decarbonization efforts. Increasing the electricity generation from renewable sources can help achieve our net-zero ambitions, ensure energy security, and decrease reliance on imports.
Warehouses against cloudy sky at sunset
by Doug Mccauley 13 December 2024
Mawdsleys signs a long-term agreement to use edenseven’s market-leading carbon reporting and management platform, cero.earth, to monitor all emissions and programmes of work to reach net zero . Mawdsleys is the UK’s largest independent pharmaceutical distributor. Established nearly 200 years ago, they have a fast-growing international network supplying medicines to meet patient needs and providing a route to market for manufacturers. Mawdsleys has signed a long term agreement with edenseven to use their carbon accounting and management platform, cero.earth. Built by edenseven, cero.earth is a cloud-based carbon accounting and management platform that provides businesses with a complete view of their emissions and decarbonisation plan. Using a dynamic view of all three emissions scopes, cero.earth provides a clear understanding of the current position against net zero targets and allows for the proactive monitoring of both current and planned projects. With a need to monitor and decarbonise operations at pace, Mawdsleys will leverage cero.earth to assess their current sustainability targets and produce a dynamic delivery plan to eradicate emissions permanently from their supply chain. Pete Nisbet, Managing Partner of edenseven, said: “We continue to evolve cero.earth to make sure we are providing our customers with the tools to dynamically monitor their decarbonisation programmes in a clear and practical manner. We are very excited to be working with Mawdsleys and are certain that, by embedding cero.earth into their net zero deliver plan, we can collectively make significant quantifiable environmental and financial gains.” William Sanders, CEO of Mawdsleys, commented; “Mawdsleys are leading the way in our sector, working towards net zero. Investment into thousands of solar panels and cutting edge battery storage technology, as well as operating electric vehicles, up to and including an HGV, makes edenseven the perfect partner to assist monitoring our decarbonisation plans. Mawdsleys are a key part of the healthcare system, delivering critical medicines to hospitals every day, so utilising cero.earth will help us maintain and enhance our position in the NHS Evergreen benchmarking assessment.” 
A ship at a port at sunset
by Doug Mccauley 29 November 2024
Thames Freeport is a unique initiative designed to stimulate trade and innovation and transform the lives of people in its region, leveraging global connectivity to over 130 ports in 65 countries. Occupying a strategic position with intermodal capabilities across river, rail, and road, Thames Freeport has recognised its opportunity to achieve social good, and has demonstrated an active commitment to advancing decarbonisation and fostering a circular economy. Thames Freeport is emerging as a hub for clean energy technologies, advanced logistics, and value-added manufacturing. Special Economic Zones (SEZs) such as the Thames Freeport are uniquely positioned to drive decarbonisation. By clustering industries and research institutions, SEZs enable collaboration on sustainable practices and green technology development. This concentration accelerates the adoption of renewable energy sources, smart grids, and circular economy practices. 
Wind turbine against blue sky with the text
by Doug Mccauley 26 November 2024
edenseven are following trends in the renewable energy sector closely, as decarbonising the energy sector is vital for ensuring a sustainable future and achieving Net Zero. Considering the recent DESNZ quarterly update of the renewable energy planning database, we have produced a consolidated summary of projects in the United Kingdom that have received planning permission. We will continue to release updates each quarter. INSIGHT In the past 12 months, the UK granted planning permission for 668 solar PV projects, which will deliver over 3,800 MW of energy capacity. This represents the second-highest number of solar projects approved in a year on a quarterly rolling basis. Additionally, these projects will provide the third-highest energy capacity for Solar PV granted planning permission in the UK in the last 15 years. However, this capacity is 20% lower than that of the 994 projects approved in the preceding year. During the same period, the number of onshore wind projects granted planning permission in the UK increased by 50%, while the number of approved offshore wind projects remained stable compared to the prior 12 months. When considering all solar PV, onshore, and offshore wind projects, granted planning permission in the UK over the past 12 months, the total energy capacity declined by 36% compared to the prior 12 months. Offshore wind saw the sharpest decline, with energy capacity from approved projects falling by 62%, while onshore wind also decreased significantly. Despite the total decline, the average energy capacity of approved solar PV projects rose by 20% year-on-year, highlighting an increase in the size of solar PV projects receiving planning permission in the UK. In contrast, both onshore and offshore wind projects experienced declines in average project capacity—down 51% and 62%, respectively.
Pylons against sky at sunset with text
by Doug Mccauley 18 November 2024
In October 2024, wind was the leading source of electricity generation in Britain, accounting for 31% of the electricity mix. Despite this, wind’s contribution was the lowest for any October in the past four years, down 3% from October 2023 and 5% from October 2022. Gas followed closely, contributing 30% to the electricity mix, which, while its second-lowest for October in the past four years, was still 3% higher than in October 2023. Biomass contributions increased by 2%, reaching 8% of the mix, the highest for October in the past four years. Solar energy provided 4% of the mix, up 1% from October 2023. Nuclear and hydro both saw a 1% decrease in their contributions, delivering 13% and 2% of the electricity mix, respectively. Imports remained steady, contributing 11%, the same as in October 2023. October 2024 was notable for having zero coal in Britain’s electricity generation, following the closure of the Ratcliffe power plant, the UK’s last coal-fired station. This is a significant achievement, considering coal has provided electricity in the UK for over 140 years and accounted for nearly 40% of the UK’s electricity generation in 2012. Zero-carbon sources made up 51% of Britain’s electricity generation in October 2024, the lowest for any October in the past four years, but only 1% below the rolling 12-month average of 52%. The carbon intensity of electricity generation in October 2024 was 138gCO₂/kWh, consistent with October 2023. The rolling 12-month average carbon intensity of 123gCO₂/kWh is 22% lower than the previous 12-month period, marking the lowest level in the past four years as the grid continues to decarbonise. Increasing the electricity generation from renewable sources can help achieve our net-zero ambitions, ensure energy security, and decrease reliance on imports.
Business people walking around outside corporate buildings
by Doug Mccauley 4 November 2024
PRESS RELEASE FOR IMMEDIATE RELEASE 3 November 2024 New Report Highlights “Alarmingly Poor” Response of FTSE250 Companies to Climate Crisis 7% rise in carbon emissions as business growth outpaced effective environmental action 41% of businesses do not have a net zero target date 20% of businesses failing to report Scope 3 emissions Average net zero target date extended by 13 months
Pylons in a field at sunset, with text
by Doug Mccauley 17 October 2024
In September 2024, wind energy was the primary source of Britain’s electricity generation, accounting for 26% of the energy mix, which was its highest contribution for September in the past four years. Gas was the second most prominent source, making up a quarter of the mix, marking its lowest contribution in the past four years and an 8% decrease compared to its contribution in September of the previous year. Nuclear power supplied 16% of Britain’s electricity, which was 1% lower than its contribution in September of the previous year. Both biomass and imports saw a 4% increase in their proportions in Britain’s electricity mix, with biomass contributing 8% and imports delivering 15%, marking the highest contributions of their respective fuel types in the past four years. Coal made its lowest contribution for September in the past four years, accounting for less than 1% of Britain’s electricity mix. Hydro and storage maintained consistent contributions compared to September of the previous year, making up 2% and 1% of the mix, respectively. Zero carbon sources contributed to half of Britain’s electricity in September 2024, marking its highest contribution for September in the past four years and a 1% increase compared to its contribution in September of the previous year. This led to the lowest carbon intensity for September in the past four years, with a 23% decrease compared to the carbon intensity for September 2023. Furthermore, the rolling 12-month average carbon intensity of 123 CO₂/kWh is currently 22% lower than the previous 12-month period, remaining the lowest of the past four years as the grid continues to decarbonise. Increasing the electricity generation from renewable sources can help achieve our net-zero ambitions, ensure energy security, and decrease reliance on imports.
Wind turbine against a blue sky, with the text
by Doug Mccauley 25 September 2024
edenseven are following trends in the renewable energy sector closely, as decarbonising the energy sector is vital for ensuring a sustainable future and achieving Net Zero. Considering the recent DESNZ quarterly update of the renewable energy planning database, we have produced a consolidated summary of projects in the United Kingdom that have received planning permission. We will continue to release updates each quarter. INSIGHT In the last 12 months, the UK approved the second-highest number of Solar PV projects in the past 14 years, with over 3,500 MW of energy capacity to be delivered. This marks the second-highest capacity in 14 years. The UK has granted permission for over 9,000 MW of energy capacity from solar, onshore, and offshore wind projects in the past 12 months, marking the third-highest capacity for any 12-month period in the last 14 years. While the average energy capacity (MW) of the solar PV projects granted planning permission in the UK remained the same as the previous 12 months and onshore wind decreased by 6%, the average energy capacity of offshore wind projects granted planning permission has significantly increased compared to the last 12-month period but remains considerably below its peak.
More posts
Share by: